. 2011 Mar 17;471(7338):336-40.
doi: 10.1038/nature09731. Epub 2011 Feb 13.

Crystal structure of a potassium ion transporter, TrkH

Affiliations

Crystal structure of a potassium ion transporter, TrkH

Yu Cao et al. Nature. .

Abstract

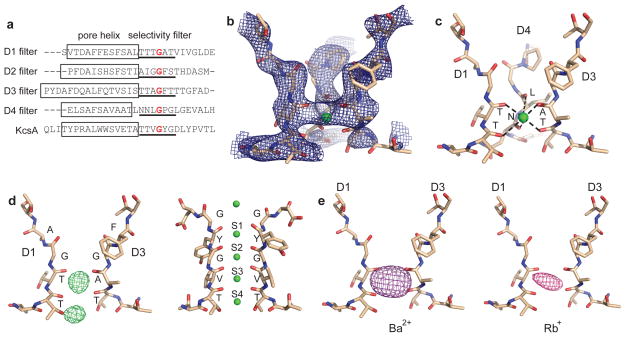
The TrkH/TrkG/KtrB proteins mediate K(+) uptake in bacteria and probably evolved from simple K(+) channels by multiple gene duplications or fusions. Here we present the crystal structure of a TrkH from Vibrio parahaemolyticus. TrkH is a homodimer, and each protomer contains an ion permeation pathway. A selectivity filter, similar in architecture to those of K(+) channels but significantly shorter, is lined by backbone and side-chain oxygen atoms. Functional studies showed that TrkH is selective for permeation of K(+) and Rb(+) over smaller ions such as Na(+) or Li(+). Immediately intracellular to the selectivity filter are an intramembrane loop and an arginine residue, both highly conserved, which constrict the permeation pathway. Substituting the arginine with an alanine significantly increases the rate of K(+) flux. These results reveal the molecular basis of K(+) selectivity and suggest a novel gating mechanism for this large and important family of membrane transport proteins.


Figures

Figure 1
Figure 1. Function and structure of VpTrkH
(a) Time-dependent 86Rb influx into liposomes reconstituted with VpTrkH (open circle) or empty vesicles (solid circle). (b) 86Rb influx at 20 minutes in the presence of three concentrations of K+ (square), Rb+ (inverted triangle), Na+ (circle), and Li+ (triangle). (c) Stereo view of the VpTrkH dimer colored by domain and viewed from the extracellular side. The twofold symmetry axis is marked as a black oval. The green spheres are K+ atoms. (d) VpTrkH viewed from within the membrane with the extracellular side on top. The dimer is rotated by 90° about the x- and y- axes relative to a. Gray rectangle representing the membrane is shown with a thickness of 30 Å. (e) VpTrkH topology shown with the extracellular side on top. The five domains are colored according to the same scheme as in the previous panels. The gray rectangle indicates the thickness of the cell membrane, and the unresolved loop is shown as a dotted line.
Figure 2
Figure 2. The VpTrkH pore
(a) Views of a VpTrkH protomer showing only the D1 and D3 domains (left) or the D2 and D4 domains (middle). Two domains of KcsA are shown on the right for comparison. K+ atoms are shown as green spheres, and the N- and C-terminal residues are labelled. (b) Surface representation of the pore of a TrkH subunit obtained with the program Hollow using a 1.4 Å probe radius for the vestibules and a 0.75 Å probe radius for the constricted region. The protein is shown with domain 2 removed for clarity and the selectivity filter (yellow), the intramembrane loop (magenta) and residue R468 (teal) highlighted. (c) Radius of the pore calculated with the program HOLE.
Figure 3
Figure 3. Selectivity filter of VpTrkH
(a) Amino acid sequence alignment of the selectivity filter regions (underlined) and pore helices (box) in VpTrkH with the selectivity filter of the KcsA K+ channel. The highly conserved glycine residue is marked in red. (b–c) The selectivity filter with domain 2 removed, shown with (b) an NCS-averaged, simulated annealing omit map calculated with six residues from each selectivity filter omitted, contoured at 1 σ, or (c) the coordination geometry of the K+ (green sphere) highlighted. (d) D1 and D3 from the K+ structure are shown with Fo-Fc electron density calculated without K+ in the model and contoured at 3.5 σ. The filter of KcsA is shown on the right for comparison. (d) Ion binding sites in the selectivity filter. Ba2+ (left) and Rb+ (right) [Fo(ion) − Fo(K+)] difference Fourier maps are shown contoured at 6.0 and 3.5 σ levels, respectively, calculated using phases from the K+ structure. The stick models are D1 and D3 from the K+ structure.
Figure 4
Figure 4. Constriction formed by Arg 468 and the intramembrane loop
(a) Stereo view of the interactions between the intramembrane loop and Arg468 as viewed looking down the selectivity filter from the extracellular side. (b) Stereo view of interactions between the intramembrane loop and Arg468 and Glu470 as viewed from within the plane of the membrane. Residues Gly353-354, Lys357, Arg360, Arg468 and Glu470 are shown as stick representations and the dashed lines indicate distances between them. (c) Time-dependent 86Rb influx into proteoliposomes reconstituted with WT (open circle) or R468A (solid circle) VpTrkH. The error bars correspond to the S.E.M.

References

    1. Hille B. Ion channels of excitable membranes. 3. Sinauer; 2001.
    1. Schultz SG, Epstein W, Solomon AK. Cation Transport in Escherichia coli. IV. Kinetics of Net K Uptake. J Gen Physiol. 1963;47:329–346. - PMC - PubMed
    1. Kroll RG, Booth IR. The role of potassium transport in the generation of a pH gradient in Escherichia coli. Biochem J. 1981;198:691–698. - PMC - PubMed
    1. Plack RH, Jr, Rosen BP. Cation/proton antiport systems in Escherichia coli. Absence of potassium/proton antiporter activity in a pH-sensitive mutant. J Biol Chem. 1980;255:3824–3825. - PubMed
    1. Bakker EP, Mangerich WE. Interconversion of components of the bacterial proton motive force by electrogenic potassium transport. J Bacteriol. 1981;147:820–826. - PMC - PubMed

Publication types

MeSH terms

Associated data