. 2010:2010:571783.
doi: 10.1155/2010/571783. Epub 2010 Dec 27.

Induction of metastatic gastric cancer by peroxisome proliferator-activated receptorδ activation

Affiliations

Induction of metastatic gastric cancer by peroxisome proliferator-activated receptorδ activation

Claire B Pollock et al. PPAR Res. 2010.

Abstract

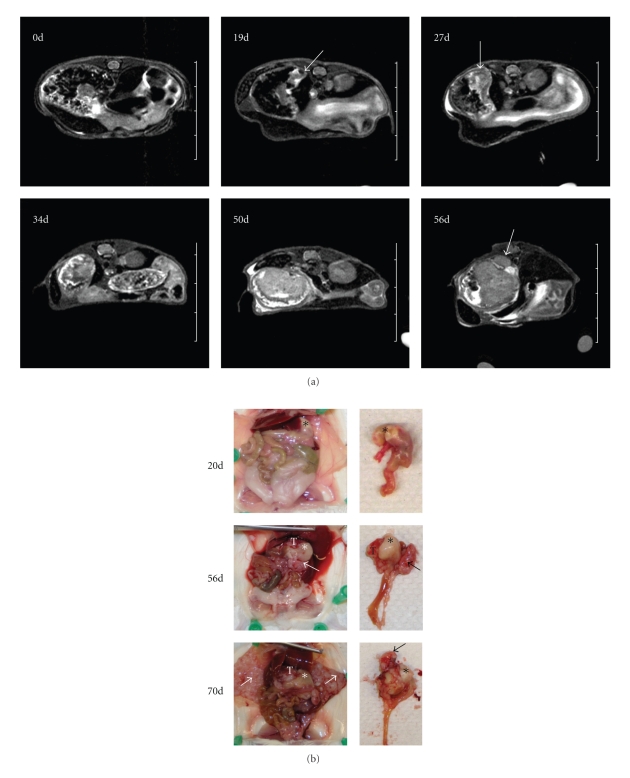
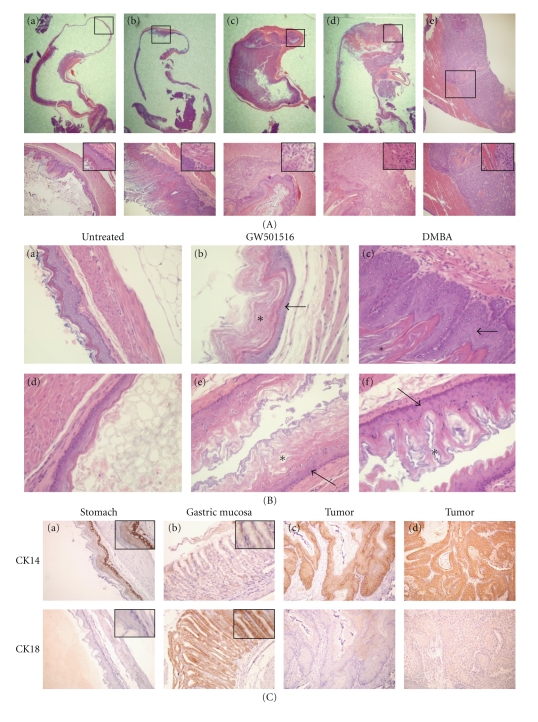
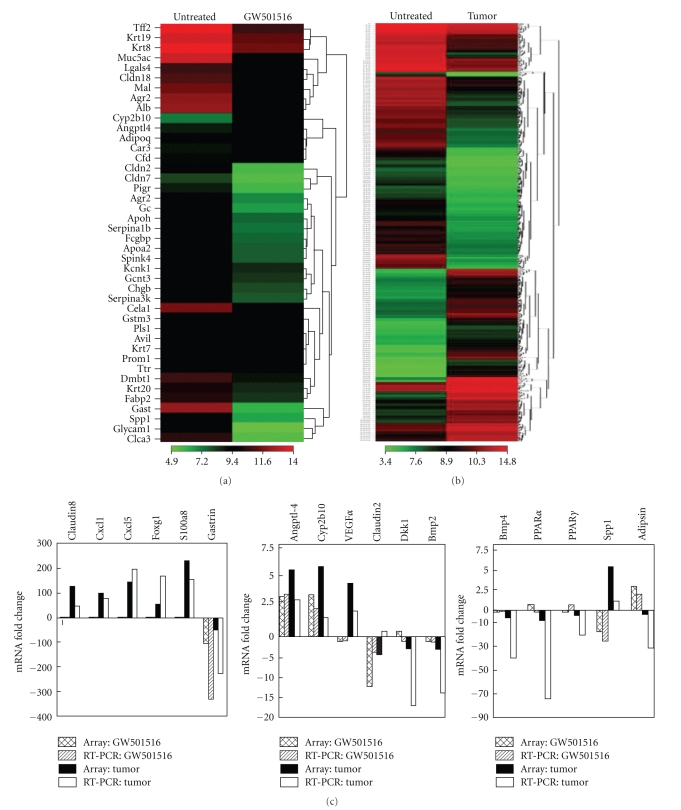
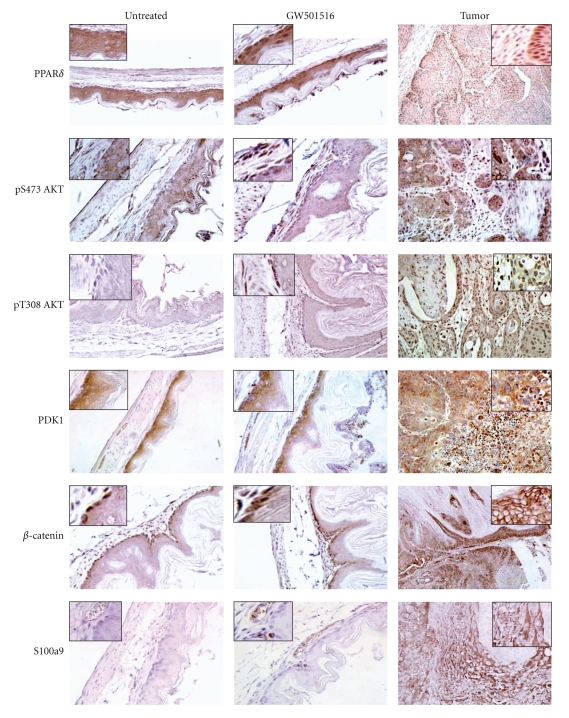
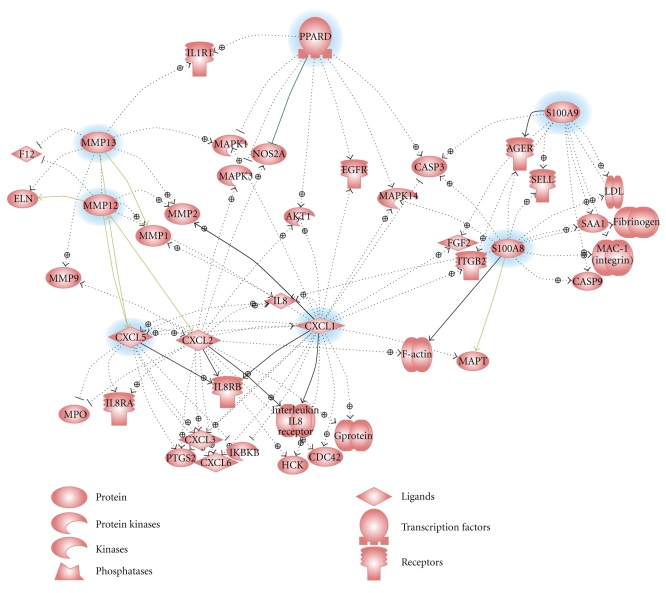
Peroxisome proliferator-activated receptorδ (PPARδ) regulates a multiplicity of physiological processes associated with glucose and lipid metabolism, inflammation, and proliferation. One or more of these processes likely create risk factors associated with the ability of PPARδ agonists to promote tumorigenesis in some organs. In the present study, we describe a new gastric tumor mouse model that is dependent on the potent and highly selective PPARδ agonist GW501516 following carcinogen administration. The progression of gastric tumorigenesis was rapid as determined by magnetic resonance imaging and resulted in highly metastatic squamous cell carcinomas of the forestomach within two months. Tumorigenesis was associated with gene expression signatures indicative of cell adhesion, invasion, inflammation, and metabolism. Increased PPARδ expression in tumors correlated with increased PDK1, Akt, β-catenin, and S100A9 expression. The rapid development of metastatic gastric tumors in this model will be useful for evaluating preventive and therapeutic interventions in this disease.


Figures

Figure 1
Figure 1
PPARδ agonist GW501516 induces gastric tumorigenesis after DMBA treatment. (a) In vivo axial T2-weighted abdominal MR Images showing gastric tumor progression at the indicated time points; d, number of days animals were administered the GW501516-supplemented diet. Tumor growth initiated in the forestomach (arrow) at 19 days, rapid tumor growth between 27 and 50 days, and tumor invasion through the stomach (arrow) at 56 days. (b) Gross morphology of tumors at indicated time points. Forestomach (*), gastric tumors (T) and metastases (arrows) are indicated. Tumor is confined within the stomach at 20 days. Invasion of primary tumor through the stomach (T) and metastases (arrow) were evident at 56 days, and intraperitoneal metastases along the abdominal wall (white arrows) occurred at 70 days.
Figure 2
Figure 2
Pathophysiology of gastric tumorigenesis. (A) Histological changes in the forestomach after GW501516 and/or DMBA treatment. Upper panel: Stereoscopic images of H&E stained sections of the stomach in (a) untreated, (b) DMBA-treated, (c, d) DMBA plus GW501516-treated mice, and (e) metastases of the abdominal wall. Lower panel: higher magnification (200x) of the boxes in areas in the upper panel. Insets, magnification 400x. (a) Morphology of the normal forestomach wall. (b) Squamous epithelial hyperplasia, where the basal membrane is well defined. (c) Squamous cell carcinoma. (d) Invasive squamous cell carcinoma showing disruption of the basement membrane. (e) Metastatic squamous carcinoma showing invasion into the abdominal wall. (B) Histological changes in the stomach and esophagus after treatment with either GW501516 or DMBA. H&E sections of the forestomach wall (a, b, c) and esophagus (d, e, f) six months after administration of GW501516 or five months after treatment with DMBA. Both GW501516 and DMBA were associated with increased keratinization (*) of squamous epithelium (arrow). Magnification 400x. (C) Cytokeratin 14 (CK14) and cytokeratin18 (CK18) expression in gastric tissue and tumors. Squamous epithelium of the forestomach (a), gastric mucosa (b), and gastric tumors (c, d). Tumors are CK14+/CK18 indicating a squamous epithelial origin. Magnification 200x, insets, 400x.
Figure 3
Figure 3
Differential gene expression in GW501516-treated stomach and gastric tumors. Gene microarray analysis was carried out with pooled RNA samples prepared from either five tissue samples of forestomach from untreated and GW501516 treated mice or six gastric tumors. Heat maps represent unsupervised hierarchical clustering of ≥3-fold changes in signal intensity normalized to untreated forestomach. (a) Heatmap of GW501516-treated versus stomach representing 42 genes. (b) Tumor versus stomach representing 811 genes. (c) qRT-PCR analysis of the relative changes in gene expression in the stomach after GW501516 treatment (GW501516), and in tumors (Tumor). GW501516 treated: array, cross-hatch; qRT-PCR, diagonal; Tumors: array, black; qRT-PCR, white.
Figure 4
Figure 4
Immunohistochemical analysis of forestomach after GW501516 treatment and gastric tumors. IHC detection of PPARδ, pS473Akt, pT308 Akt, PDK1, β-catenin, and S100a9. Magnification: untreated and GW501516 treated, 400x; tumor, PPARδ, PDK1, and β-catenin, 200x; pT308Akt, pS473Akt, S100a9, and 400x. Inset, 2x original magnification. PPARδ shows diffuse reactivity in untreated gastric squamous epithelium, increased nuclear localization after GW501516 treatment, and strong nuclear expression in tumor and stromal cells (inset). pS473Akt and pT308Akt expressed weak diffuse reactivity in untreated gastric tissue, increased staining in basal cells and the submucosal cell layer after GW501516 treatment, and strong reactivity in tumor and stromal cells. PDK1 exhibited diffuse cytoplasmic localization throughout the untreated squamous epithelium and was unchanged after GW501516 treatment, whereas PDK1 was increased in tumors similarly to pS473Akt and pT308Akt. Nuclear β-catenin was present in basal cells of untreated squamous epithelium and was unchanged after GW501516 treatment, whereas tumors expressed increased β-catenin at cellular junctions (inset). S100a9 was undetectable in untreated tissue and was increased in blood vessels and squamous epithelium (inset), whereas tumors exhibited increased diffuse cytoplasmic staining.
Figure 5
Figure 5
Signaling networks associated with PPARδ and inflammatory and invasive gene expression. Common signaling pathways were analyzed for six genes with the greatest changes in expression in gastric tumors (highlighted in blue) versus forestomach using Ariadne Pathway Studio 7.1.

References

    1. Lochhead P, El-Omar EM. Gastric cancer. British Medical Bulletin. 2008;85(1):87–100. - PubMed
    1. Forman D, Burley VJ. Gastric cancer: global pattern of the disease and an overview of environmental risk factors. Best Practice and Research: Clinical Gastroenterology. 2006;20(4):633–649. - PubMed
    1. van Loon AJM, Botterweck AAM, Goldbohm RA, Brants HAM, van Klaveren JD, van den Brandt PA. Intake of nitrate and nitrite and the risk of gastric cancer: a prospective cohort study. British Journal of Cancer. 1998;78(1):129–135. - PMC - PubMed
    1. Nishino Y, Inoue M, Tsuji I, et al. Tobacco smoking and gastric cancer risk: an evaluation based on a systematic review of epidemiologic evidence among the Japanese population. Japanese Journal of Clinical Oncology. 2006;36(12):800–807. - PubMed
    1. Eslick GD. Helicobacter pylori infection causes gastric cancer? A review of the epidemiological, meta-analytic, and experimental evidence. World Journal of Gastroenterology. 2006;12(18):2991–2999. - PMC - PubMed

LinkOut - more resources