. 2011 May;120(2):352-64.
doi: 10.1037/a0022124.

Externalizing psychopathology and gain-loss feedback in a simulated gambling task: dissociable components of brain response revealed by time-frequency analysis

Affiliations

Externalizing psychopathology and gain-loss feedback in a simulated gambling task: dissociable components of brain response revealed by time-frequency analysis

Edward M Bernat et al. J Abnorm Psychol. 2011 May.

Abstract

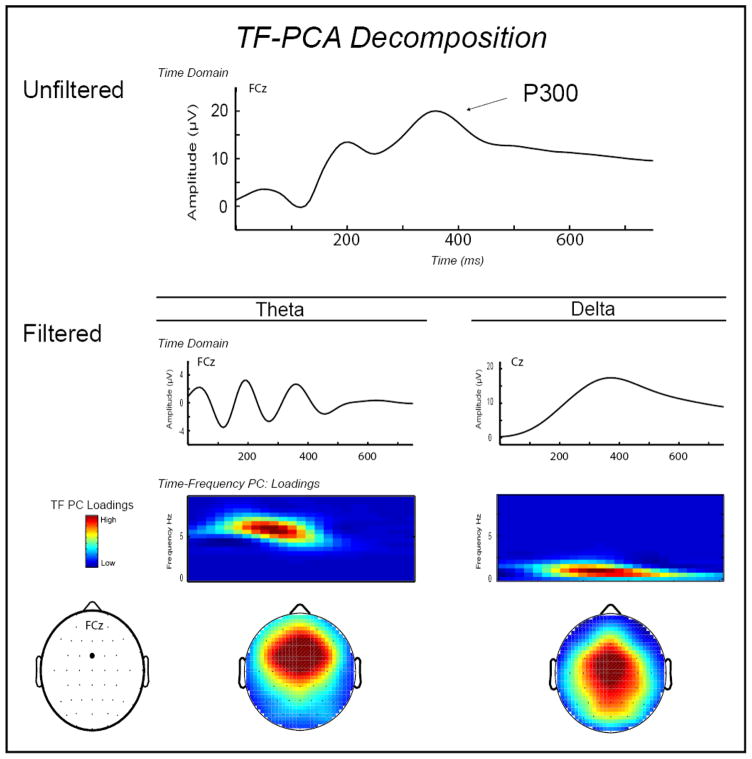
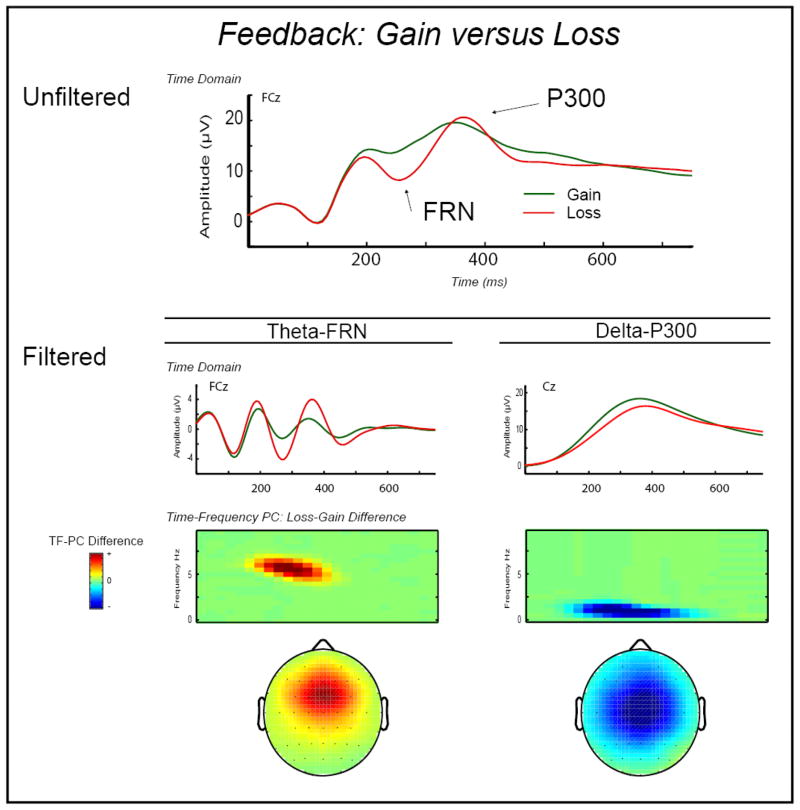
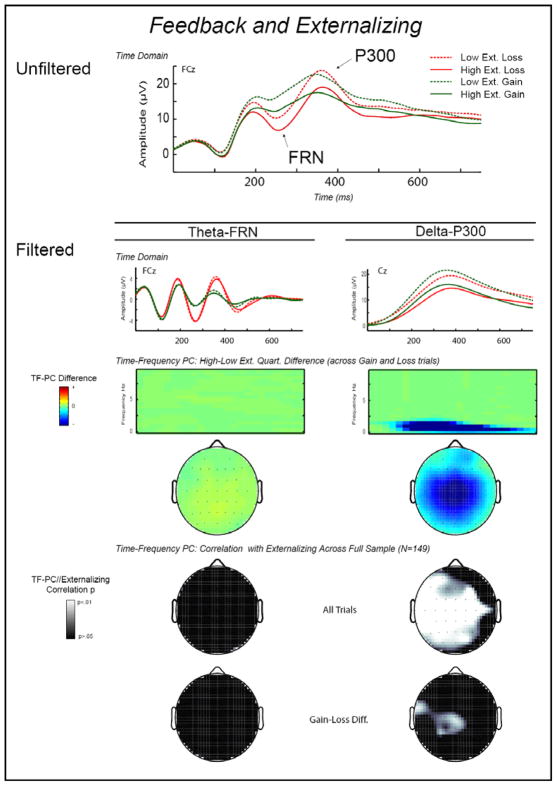
Externalizing is a broad construct that reflects propensity toward a variety of impulse control problems, including antisocial personality disorder and substance use disorders. Two event-related potential responses known to be reduced among individuals high in externalizing proneness are the P300, which reflects postperceptual processing of a stimulus, and the error-related negativity (ERN), which indexes performance monitoring based on endogenous representations. In the current study, the authors used a simulated gambling task to examine the relation between externalizing proneness and the feedback-related negativity (FRN), a brain response that indexes performance monitoring related to exogenous cues, which is thought to be highly related to the ERN. Time-frequency (TF) analysis was used to disentangle the FRN from the accompanying P300 response to feedback cues by parsing the overall feedback-locked potential into distinctive theta (4-7 Hz) and delta (<3 Hz) TF components. Whereas delta-P300 amplitude was reduced among individuals high in externalizing proneness, theta-FRN response was unrelated to externalizing. These findings suggest that in contrast with previously reported deficits in endogenously based performance monitoring (as indexed by the ERN), individuals prone to externalizing problems show intact monitoring of exogenous cues (as indexed by the FRN). The results also contribute to a growing body of evidence indicating that the P300 is attenuated across a broad range of task conditions in high-externalizing individuals.


Figures

Figure 1
Figure 1
Results from a time-frequency (TF) decomposition of average ERP activity for Gain and Loss trials combined. Waveform plot, top level: Average unfiltered ERP activity at FCz for all trials. Waveform plots, second level: Average time-domain ERP activity on all trials, frequency-filtered (3rd order Butterworth) to capture activity in the theta (3–9 Hz bandpass) range corresponding to FRN response (FCz; left plot) and activity in the delta (3 Hz lowpass) range corresponding to the P300 response (Cz; right plot). Color surface plots, third level: Time-frequency representation of the theta-FRN and delta-P300 principal component scores following feedback onset on Loss and Gain trials combined. Topographical maps, bottom level: Scalp topography distributions for the mean of the TF-PCA energy for the theta-FRN (left map) and delta-P300 (right map) components. From the topographic maps, it can be seen that the theta-FRN activity is maximal fronto-centrally (at FCz), whereas the delta-P300 activity is maximal more centrally (at Cz), consistent with interpretation of these components as measures of “FRN” and “P300,” respectively.
Figure 2
Figure 2
Time-domain and time-frequency representations of FRN and P300 differences for Loss versus Gain trials. Top line plot: Average response-locked ERP waveforms at FCz, depicting the expected negativity for Loss versus Gain trials associated with the FRN as well as the time-domain P300. Waveform plots, second level: Average time-domain ERP activity for Loss and Gain trials separately, frequency-filtered to capture activity in the theta (3–9 Hz) range corresponding to FRN response (FCz; left plot) and activity in the delta (3 Hz) range corresponding to the P300 response (Cz; right plot). These plots demonstrate that theta and delta show opposing effects for loss compared with gain feedback such that theta is stronger for loss versus gain whereas delta is stronger for gain versus loss. Color surface plots, third level: Loss-Gain difference scores for the principal component loadings on theta-FRN (left map) and delta-P300 (right map), derived from a TF decomposition of average EEG activity following Loss and Gain trials. Topographical maps, bottom level: Scalp topography distributions for the mean condition difference (Loss-Gain) of TF-PCA loadings for theta-FRN (left map) and delta-P300 (right map). Similar to the time-domain FRN and P300, electrodes FCz and Cz, respectively, were most proximal topographically to the maximum theta and delta Gain-Loss differences. However, compared to the highly correlated time-domain FRN and P300, the Gain-Loss difference scores for theta and delta were uncorrelated. The implication is that these theta and delta TF measures index separate processes that differentiate between Loss and Gain feedback outcomes.
Figure 3
Figure 3
Time-domain and time-frequency representations of FRN and P300 to Loss and Gain feedback, depicted separately for subgroups of high (N = 57) and low (N = 40) externalizing participants as defined by scores on a 100-item version of the Externalizing Inventory (Krueger, Markon, Patrick, Benning, & Kramer, 2007). High and low externalizing groups were formed by oversampling from the top and bottom 25% of scorers in an undergraduate screening pool. Waveform plot, top level: Average unfiltered ERP activity following Loss and Gain feedback for these high and low externalizing subgroups. Here, a broad amplitude reduction is evident for individuals in the high relative to those in the low externalizing group. In this unfiltered data, however, it is unclear whether this overall amplitude reduction reflects differences in theta-FRN or delta-P300. Waveform plots, second level: Average time-domain ERP activity following Loss and Gain feedback stimuli for these extreme subgroups, frequency-filtered (3rd order Butterworth) to capture activity in the theta (3–9 Hz bandpass) range corresponding to FRN response (left plot) and activity in the delta (3 Hz lowpass) range corresponding to the P300 response (right plot). Color surface plots, third level: Time-frequency representation of TF-PCA principal component scores reflecting the theta-FRN and delta-P300 activity from the ERP signal, derived from a TF decomposition of average EEG activity following Loss and Gain trials. Statistical maps, bottom level: Scalp topography distributions, for the overall study sample (N = 149) that included these extreme subgroups, of p-values from correlations between externalizing scores and scores on the theta-FRN and delta-P300 TF-PCA components for: (1) all trials combined, (2) Gain trials, (3) Loss trials, and (4) Gain-Loss difference scores. These topographic statistical maps demonstrate that the association between externalizing and theta-FRN is pervasively nonsignificant, whereas the delta-P300 activity is significantly reduced for high externalizing individuals for the conditions reported, in particular when considering the average response or Loss and Gain trials separately. Thus, the reduced EEG activity in the unfiltered time-domain waveform at the top is attributable to reductions in the delta but not the theta frequency band.

References

    1. Achenbach TM, Edelbrock CS. The classification of child psychopathology: A review and analysis of empirical efforts. Psychological Bulletin. 1978;85(6):1275–1301. - PubMed
    1. Barratt ES, Stanford MS, Felhous AR, Kent TA. The effects of phenytoin on impulsive and premeditated aggression: A controlled study. Journal of Clinical Psychopharmacology. 1997;17:341–349. - PubMed
    1. Ba ar-Eroglu C, Ba ar E, Demiralp T, Schürmann M. P300-response: Possible psychophysiological correlates in delta and theta frequency channels. A review. International Journal of Psychophysiology. 1992;13:161–179. - PubMed
    1. Ba ar-Eroglu C, Demiralp T, Schürmann M, Ba ar E. Topological distribution of oddball ‘P300’ responses. International Journal of Psychophysiology. 2001;39:213–220. - PubMed
    1. Bernat EM, Malone SM, Williams WJ, Patrick CJ, Iacono Decomposing delta, theta, and alpha time-frequency ERP activity from a visual oddball task using PCA. International Journal of Psychophysiology. 2007;64:62–74. - PMC - PubMed

Publication types