. 2011 Jul;72(1):51-62.
doi: 10.1111/j.1365-2125.2011.03940.x.

Variability in the population pharmacokinetics of isoniazid in South African tuberculosis patients

Affiliations

Variability in the population pharmacokinetics of isoniazid in South African tuberculosis patients

Justin J Wilkins et al. Br J Clin Pharmacol. 2011 Jul.

Abstract

Aim: This study was designed to characterize the population pharmacokinetics of isoniazid in South African pulmonary tuberculosis patients.

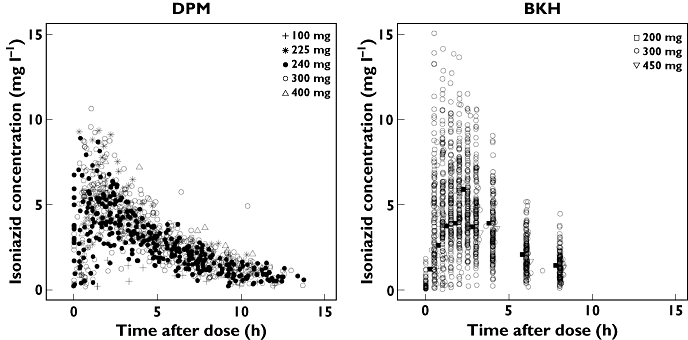
Methods: Concentration-time measurements obtained from 235 patients receiving oral doses of isoniazid as part of routine tuberculosis chemotherapy in two clinical studies were pooled and subjected to nonlinear mixed-effects analysis.

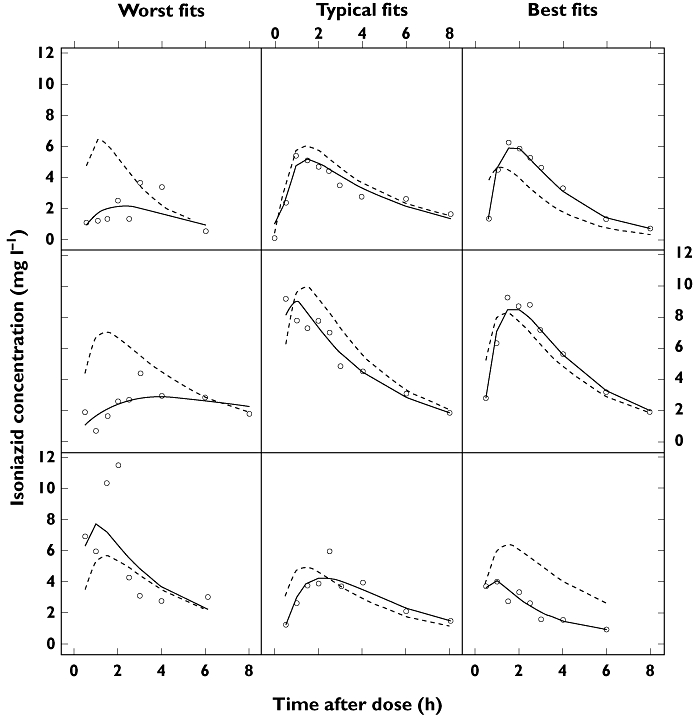
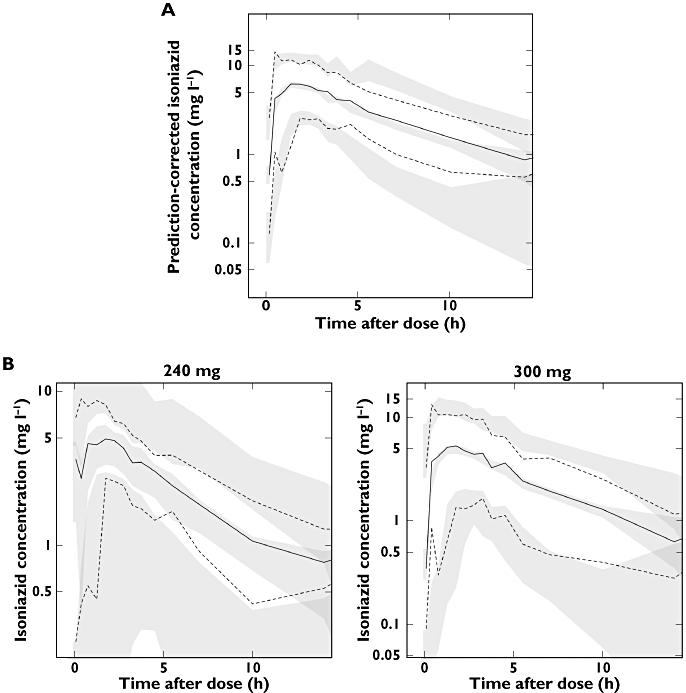
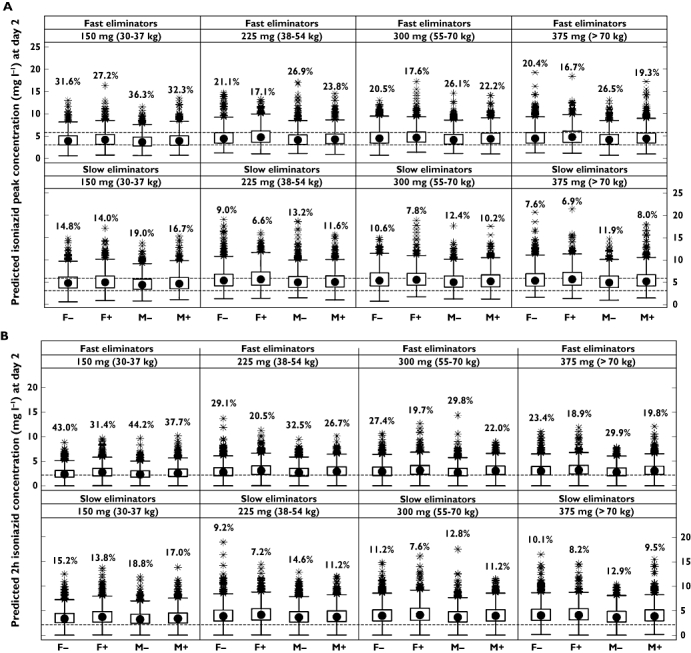
Results: A two-compartmental model, including first-order absorption and elimination with allometric scaling, was found to describe the observed dose-exposure relationship for oral isoniazid adequately. A mixture model was used to characterize dual rates of isoniazid elimination. Estimates of apparent clearance in slow and fast eliminators were 9.70 and 21.6 l h(-1) , respectively. The proportion of fast eliminators in the population was estimated to be 13.2%. Central volume of distribution was estimated to be 10% smaller in female patients and clearance was found to be 17% lower in patients with HIV. Variability in absorption rate (90%) was completely interoccasional in nature, whereas in relative bioavailability, interoccasional variability (8.4%) was lower than interindividual variability (26%). Oral doses, given once daily according to dosing policies at the time, were sufficient to reach therapeutic concentrations in the majority of the studied population, regardless of eliminator phenotype. Simulations suggested that current treatment guidelines (5 mg kg(-1) ) may be suboptimal in fast eliminators with low body weight.

Conclusions: A population pharmacokinetic model was developed to characterize the highly variable pharmacokinetics of isoniazid in a South African pulmonary tuberculosis patient population. Current treatment guidelines may lead to underexposure in rapid isoniazid eliminators.


Figures

Figure 1
Figure 1
Observed isoniazid concentrations plotted against time after dose, obtained from patients at DP Marais SANTA Centre (DPM) and Brewelskloof Hospital (BKH). Dosing was 5 days per week, Monday to Friday, at DPM, and daily at BKH, owing to policy differences between the sites. Time points for 200 mg and 450 mg doses in the BKH plot have been jittered by 0.25 h to facilitate visibility
Figure 2
Figure 2
Plots of the observations (open circles), individual predictions (solid lines) and population predictions (dotted lines) from the final pharmacokinetic model, to illustrate goodness-of-fit for fast absorbers and slow absorbers. ‘Worst fit’, ‘Typical fit’ and ‘Best fit’ denote degree of goodness-of-fit, categorized by the median of the absolute weighted individual residuals (IWRES) in each individual. C = isoniazid plasma concentration
Figure 3
Figure 3
(A) A prediction-corrected visual predictive check (PC-VPC) and (B) VPCs stratified for 240 mg and 300 mg doses. The open circles are the observed data points, solid lines are the 2.5th, 50th and 97.5th percentiles of the observations (binned by time interval), dashed lines are the 2.5th, 50th and 97.5th percentiles of the simulated data, and the shaded regions represent the 95% confidence intervals for the simulation percentiles)
Figure 4
Figure 4
Distribution of simulated pharmacokinetic metrics after 2 days of continuous dosing in fast and slow eliminators using doses based on current WHO guidelines (5 mg kg−1 body weight), stratified by eliminator status and weight-based dosing band (30–37 kg = 150 mg, 38–54 kg = 225 mg, 55–70 kg = 300 mg, >70 kg = 375 mg). (A) Isoniazid peak concentration (Cmax); percentages are the number of Cmax values under 3 mg l−1; dashed horizontal lines represent the ‘normal range’ of 3–6 mg l−1. (B) Isoniazid concentration at 2 h post-dose; percentages are the number of concentrations under 2.19 mg l−1 (represented by the dashed horizontal line), the threshold associated with 90% of maximal EBA. (C) Isoniazid area under the curve (AUC(0,∞)); percentages are the number of concentrations under 10.52 mg l−1 h (represented by the dashed horizontal line), the threshold associated with 90% of maximal EBA. Solid circles are medians, open circles are outliers, boxes represent the interquartile range, and whiskers extend to the most extreme data point which is no more than 1.5 times the length of the box away from the box
Figure 4
Figure 4
Distribution of simulated pharmacokinetic metrics after 2 days of continuous dosing in fast and slow eliminators using doses based on current WHO guidelines (5 mg kg−1 body weight), stratified by eliminator status and weight-based dosing band (30–37 kg = 150 mg, 38–54 kg = 225 mg, 55–70 kg = 300 mg, >70 kg = 375 mg). (A) Isoniazid peak concentration (Cmax); percentages are the number of Cmax values under 3 mg l−1; dashed horizontal lines represent the ‘normal range’ of 3–6 mg l−1. (B) Isoniazid concentration at 2 h post-dose; percentages are the number of concentrations under 2.19 mg l−1 (represented by the dashed horizontal line), the threshold associated with 90% of maximal EBA. (C) Isoniazid area under the curve (AUC(0,∞)); percentages are the number of concentrations under 10.52 mg l−1 h (represented by the dashed horizontal line), the threshold associated with 90% of maximal EBA. Solid circles are medians, open circles are outliers, boxes represent the interquartile range, and whiskers extend to the most extreme data point which is no more than 1.5 times the length of the box away from the box

Similar articles

Cited by

References

    1. World Health Organization. Global Tuberculosis Control: WHO Report 2010. WHO/HTM/TB/2010.7. Geneva: World Health Organization; 2010.
    1. Wood R. The case for integrating tuberculosis and HIV treatment services in South Africa. J Infect Dis. 2007;196(Suppl 3):S497–499. - PubMed
    1. Jindani A, Aber VR, Edwards EA, Mitchison DA. The early bactericidal activity of drugs in patients with pulmonary tuberculosis. Am Rev Respir Dis. 1980;121:939–49. - PubMed
    1. Donald PR, Sirgel FA, Botha FJ, Seifart HI, Parkin DP, Vandenplas ML, van de Wal BW, Maritz JS. The early bactericidal activity of isoniazid related to its dose size in pulmonary tuberculosis. Am J Respir Crit Care Med. 1997;156:895–900. - PubMed
    1. Donald PR, Sirgel FA, Venter A, Parkin DP, Seifart HI, van de Wal BW, Werely C, van Helden PD, Maritz JS. The influence of human N-acetyltransferase genotype on the early bactericidal activity of isoniazid. Clin Infect Dis. 2004;39:1425–30. - PubMed

Publication types