. 2011 Feb 14:11:3.
doi: 10.1186/1475-2867-11-3.

Role of hypoxia and glycolysis in the development of multi-drug resistance in human tumor cells and the establishment of an orthotopic multi-drug resistant tumor model in nude mice using hypoxic pre-conditioning

Affiliations

Role of hypoxia and glycolysis in the development of multi-drug resistance in human tumor cells and the establishment of an orthotopic multi-drug resistant tumor model in nude mice using hypoxic pre-conditioning

Lara Milane et al. Cancer Cell Int. .

Abstract

Background: The development of multi-drug resistant (MDR) cancer is a significant challenge in the clinical treatment of recurrent disease. Hypoxia is an environmental selection pressure that contributes to the development of MDR. Many cancer cells, including MDR cells, resort to glycolysis for energy acquisition. This study aimed to explore the relationship between hypoxia, glycolysis, and MDR in a panel of human breast and ovarian cancer cells. A second aim of this study was to develop an orthotopic animal model of MDR breast cancer.

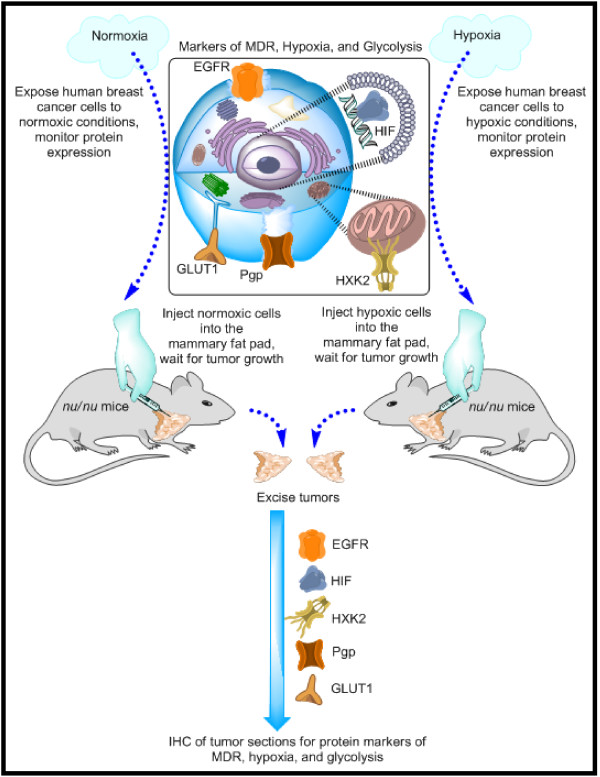
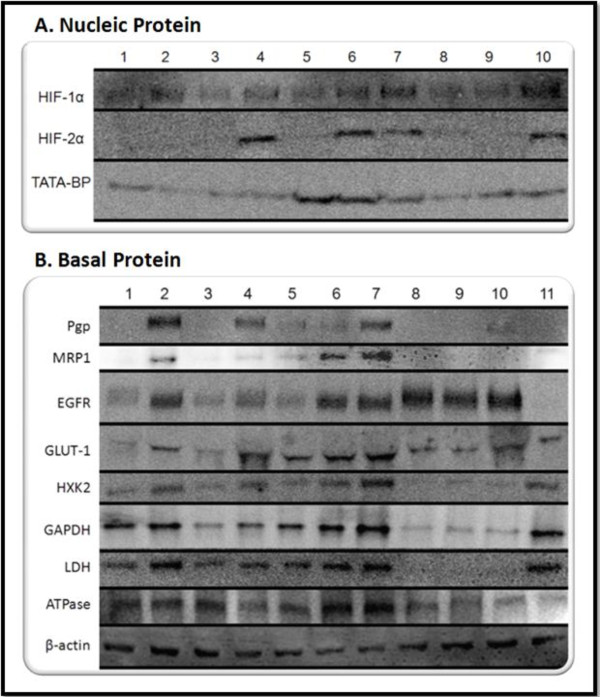
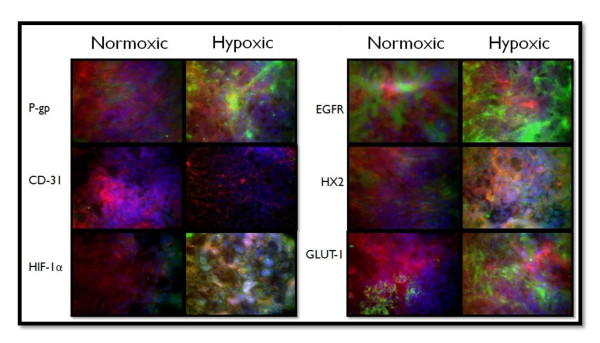
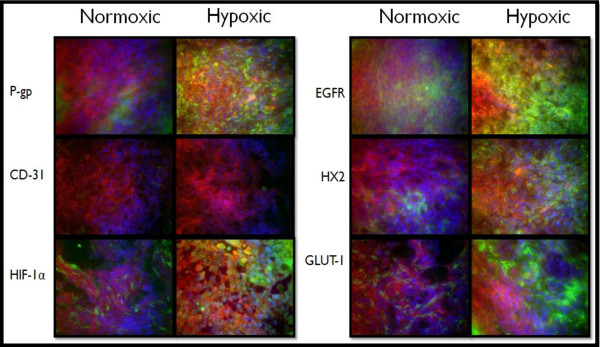
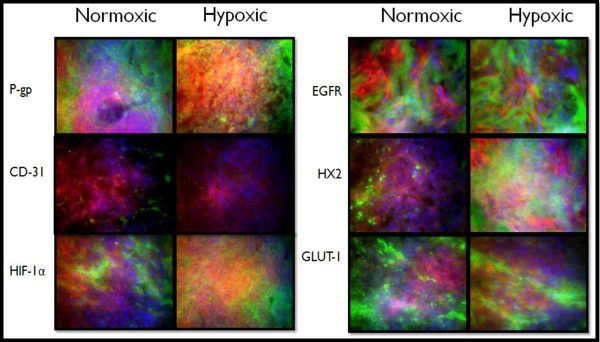
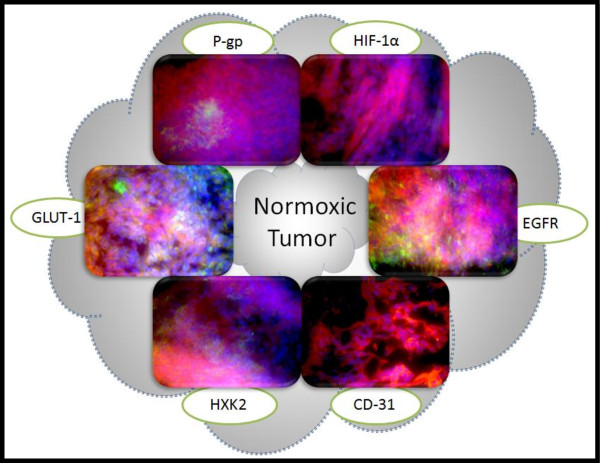
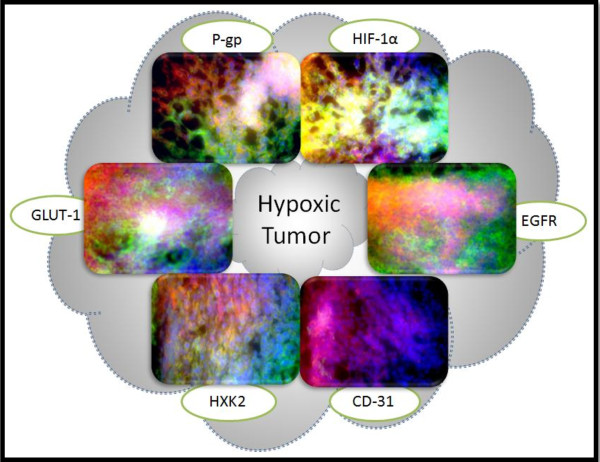
Methods: Nucleic and basal protein was extracted from a panel of human breast and ovarian cancer cells; MDR cells and cells pre-exposed to either normoxic or hypoxic conditions. Western blotting was used to assess the expression of MDR markers, hypoxia inducible factors, and glycolytic proteins. Tumor xenografts were established in the mammary fat pad of nu/nu mice using human breast cancer cells that were pre-exposed to either hypoxic or normoxic conditions. Immunohistochemistry was used to assess the MDR character of excised tumors.

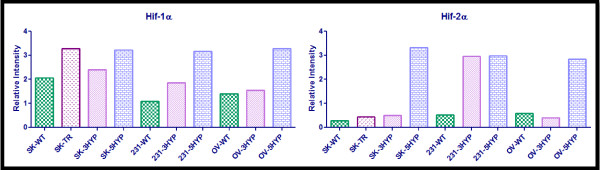
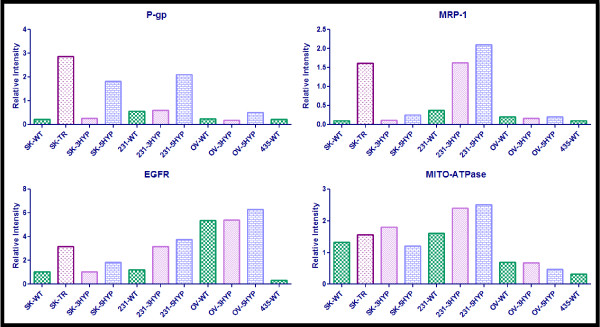
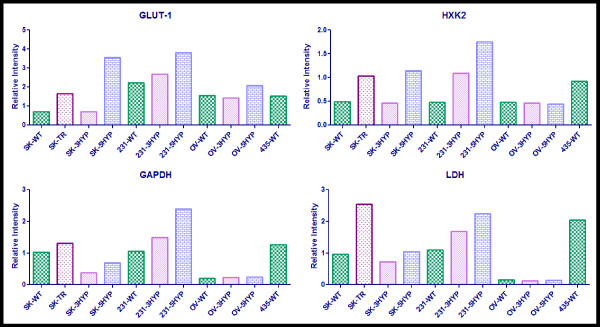
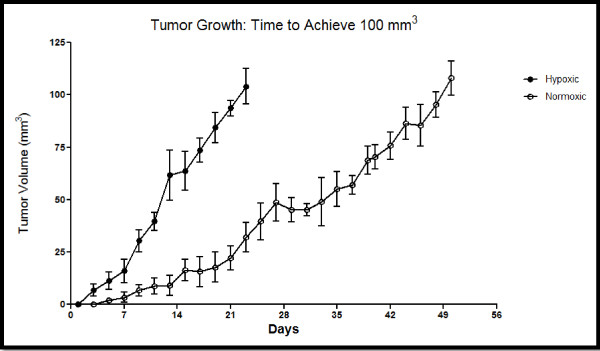
Results: Hypoxia induces MDR and glycolysis in vitro, but the cellular response is cell-line specific and duration dependent. Using hypoxic, triple-negative breast cancer cells to establish 100 mm3 tumor xenografts in nude mice is a relevant model for MDR breast cancer.

Conclusion: Hypoxic pre-conditiong and xenografting may be used to develop a multitude of orthotopic models for MDR cancer aiding in the study and treatment of the disease.


Figures

Figure 1
Figure 1
Experimental Schema. The primary aim of the current study was the development of an orthotopic model of multidrug resistant (MDR) breast cancer. To achieve that aim we conducted a study with two phases, in vitro and in vivo, as portrayed by the top and bottom portions of the figure. The first phase of the study consisted of exposing a panel of human cancer cells to either normoxic or hypoxic conditions and measuring the expression of protein markers for MDR, hypoxia, and glycolysis. These markers are portrayed by the cell diagram in the top, middle segment of the figure. The second phase of the study entailed selecting one cell line, exposing the human breast cancer cells to either normoxic or hypoxic conditions for five days, and then xenografting these cells into the mammary fat pad of nude mice. After tumors grew to 100 mm3, 250 mm3, and 500 mm3, they were excised and immunohistochemistry (IHC) was used to assess the expression of MDR, hypoxic, and glycolytic markers. Hypoxic pre-conditioning of xenografted cells did result in tumors with more MDR character than tumors established from normoxic cells. EGFR, epidermal growth factor receptor; HIF, hypoxia inducible factor; HXK2, hexokinase 2; Pgp, P-glycoprotein; GLUT1, glucose transporter 1.
Figure 2
Figure 2
Protein Expression Analysis. Nucleic protein (A) and basal protein (B) were extracted from the panel of cell lines grown under normoxic (wild-type; WT) and hypoxic conditions (three and five days of hypoxia; 3-day Hyp and 5-day Hyp). The nuclear protein was probed for expression of the hypoxia inducible transcription factors HIF-1α and HIF-2α (TATA-binding protein was used as a nuclear loading control). Basal protein was probed for expression of MDR markers (P-glycoprotein, Pgp; multidrug resistance protein 1, MRP1), EGFR, glycolytic proteins (GLUT-1 glucose transporter; Hexokinase 2, HXK2; glyceraldehyde-3-phosphate dehydrogenase, GAPDH; lactate dehydrogenase, LDH), and mitochondrial ATP synthase. β-actin was used as a loading control for basal protein.
Figure 3
Figure 3
Semi-quantitative Analysis of HIF-1α and HIF-2α. Image J software was used to determine the relative intensity of protein expression. The integrated density of each band was measured; this value was divided by the integrated density of the TATA-binding protein band to determine the relative intensity. All wild-type, normoxic (WT) cell lines are indicated by checkered green bars, all cell lines exposed to 3-days hypoxia (3HYP) are indicated by diagonal-lined pink bars, all cell lines exposed to 5-days of hypoxia (5HYP) are displayed by blue brick bars, and the established MDR cell line (TR) is displayed as the speckled purple bar (the second bar on each graph). The cell lines are SKOV3 (SK), MDA-MB-231 (231), and OVCAR5 (OV).
Figure 4
Figure 4
Semi-quantitative Analysis of P-gp, MRP-1, EGFR, and MITO-ATPase. Image J software was used to determine the relative intensity of protein expression. The integrated density of each band was measured; this value was divided by the integrated density of the β-actin protein band to determine the relative intensity. All wild-type, normoxic (WT) cell lines are indicated by checkered green bars, all cell lines exposed to 3-days hypoxia (3HYP) are indicated by diagonal-lined pink bars, all cell lines exposed to 5-days of hypoxia (5HYP) are displayed by blue brick bars, and the established MDR cell line (TR) is displayed as the speckled purple bar (the second bar on each graph). The cell lines are SKOV3 (SK), MDA-MB-231 (231), OVCAR5 (OV), and MDA-MB-435 (435).
Figure 5
Figure 5
Semi-quantitative Analysis of GLUT-1, HXK2, GAPDH, and LDH. Image J software was used to determine the relative intensity of protein expression. The integrated density of each band was measured; this value was divided by the integrated density of the β-actin protein band to determine the relative intensity. All wild-type, normoxic (WT) cell lines are indicated by checkered green bars, all cell lines exposed to 3-days hypoxia (3HYP) are indicated by diagonal-lined pink bars, all cell lines exposed to 5-days of hypoxia (5HYP) are displayed by blue brick bars, and the established MDR cell line (TR) is displayed as the speckled purple bar (the second bar on each graph). The cell lines are SKOV3 (SK), MDA-MB-231 (231), OVCAR5 (OV), and MDA-MB-435 (435).
Figure 6
Figure 6
Immunohistochemistry of 100 mm3 Normoxic and Hypoxic Tumor Xenografts. Tissue sections were probed with primary antibodies against the protein of interest, then labeled with Alexa Fluor® 488 conjugated secondary antibodies (green). F-actin was stained with Alexa Fluor® 568 phalloidin (red) and nuclei were stained with Hoechst 33342 (blue). These images represent protein expression in the tumor core.
Figure 7
Figure 7
Immunohistochemistry of 250 mm3 Normoxic and Hypoxic Tumor Xenografts. Tissue sections were probed with primary antibodies against the protein of interest, then labeled with Alexa Fluor® 488 conjugated secondary antibodies (green). F-actin was stained with Alexa Fluor® 568 phalloidin (red) and nuclei were stained with Hoechst 33342 (blue). These images represent protein expression in the tumor core.
Figure 8
Figure 8
Immunohistochemistry of 500 mm3 Normoxic and Hypoxic Tumor Xenografts. Tissue sections were probed with primary antibodies against the protein of interest, then labeled with Alexa Fluor® 488 conjugated secondary antibodies (green). F-actin was stained with Alexa Fluor® 568 phalloidin (red) and nuclei were stained with Hoechst 33342 (blue). These images represent protein expression in the tumor core.
Figure 9
Figure 9
Normoxic and Hypoxic tumor Growth; Time to Achieve 100 mm3. Normoxic and Hypoxic tumor xenografts were established in the mammary fat pad of female nude mice and tumor growth was monitored until 100 mm3 tumors were achieved. The tumor size was measured every other day using Vernier calipers in two dimensions. Individual tumor volumes were calculated using the formula volume = [length × (width)2]/2 where the length was the longest diameter and the width was the shortest diameter perpendicular to length. For each group, n = 6. Each data point represents the mean ± SD.
Figure 10
Figure 10
Immunohistochemistry of 100 mm3 Normoxic Tumor Perimeter. Tissue sections were probed with primary antibodies against the protein of interest, then labeled with Alexa Fluor® 488 conjugated secondary antibodies (green). F-actin was stained with Alexa Fluor® 568 phalloidin (red) and nuclei were stained with Hoechst 33342 (blue). These images represent protein expression in the tumor perimeter.
Figure 11
Figure 11
Immunohistochemistry of 100 mm3 Hypoxic Tumor Perimeter. Tissue sections were probed with primary antibodies against the protein of interest, then labeled with Alexa Fluor® 488 conjugated secondary antibodies (green). F-actin was stained with Alexa Fluor® 568 phalloidin (red) and nuclei were stained with Hoechst 33342 (blue). These images represent protein expression in the tumor perimeter.

References

    1. Harris AL, Hochhauser D. Mechanisms of multidrug resistance in cancer treatment. Acta oncologica (Stockholm, Sweden) 1992;31(2):205–213. doi: 10.3109/02841869209088904. - DOI - PubMed
    1. Jamroziak K, Robak T. Pharmacogenomics of MDR1/ABCB1 gene: the influence on risk and clinical outcome of haematological malignancies. Hematology (Amsterdam, Netherlands) 2004;9(2):91–105. - PubMed
    1. Leighton JC Jr, Goldstein LJ. P-glycoprotein in adult solid tumors. Expression and prognostic significance. Hematology/oncology clinics of North America. 1995;9(2):251–273. - PubMed
    1. Tredan O, Galmarini CM, Patel K, Tannock IF. Drug resistance and the solid tumor microenvironment. Journal of the National Cancer Institute. 2007;99(19):1441–1454. doi: 10.1093/jnci/djm135. - DOI - PubMed
    1. Tsuruo T, Naito M, Tomida A, Fujita N, Mashima T, Sakamoto H, Haga N. Molecular targeting therapy of cancer: drug resistance, apoptosis and survival signal. Cancer science. 2003;94(1):15–21. doi: 10.1111/j.1349-7006.2003.tb01345.x. - DOI - PMC - PubMed