. 2011 Feb 14:11:45.
doi: 10.1186/1471-2148-11-45.

The origin of multicellularity in cyanobacteria

Affiliations

The origin of multicellularity in cyanobacteria

Bettina E Schirrmeister et al. BMC Evol Biol. .

Abstract

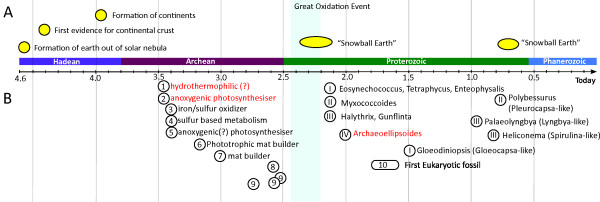
Background: Cyanobacteria are one of the oldest and morphologically most diverse prokaryotic phyla on our planet. The early development of an oxygen-containing atmosphere approximately 2.45-2.22 billion years ago is attributed to the photosynthetic activity of cyanobacteria. Furthermore, they are one of the few prokaryotic phyla where multicellularity has evolved. Understanding when and how multicellularity evolved in these ancient organisms would provide fundamental information on the early history of life and further our knowledge of complex life forms.

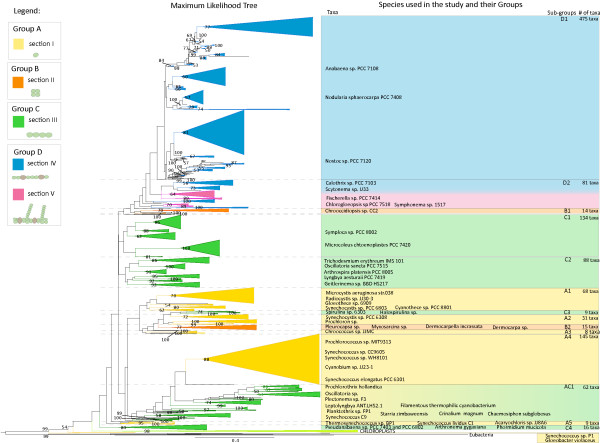
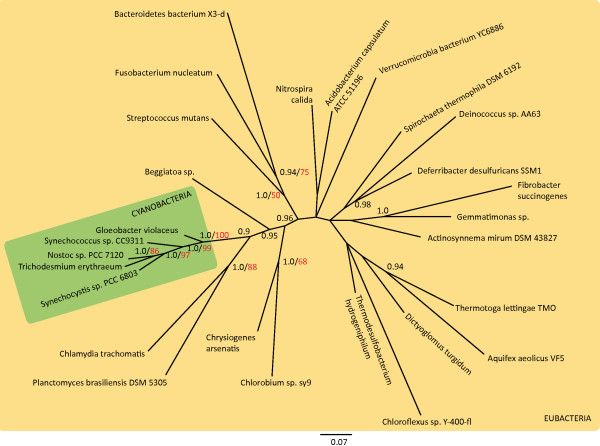
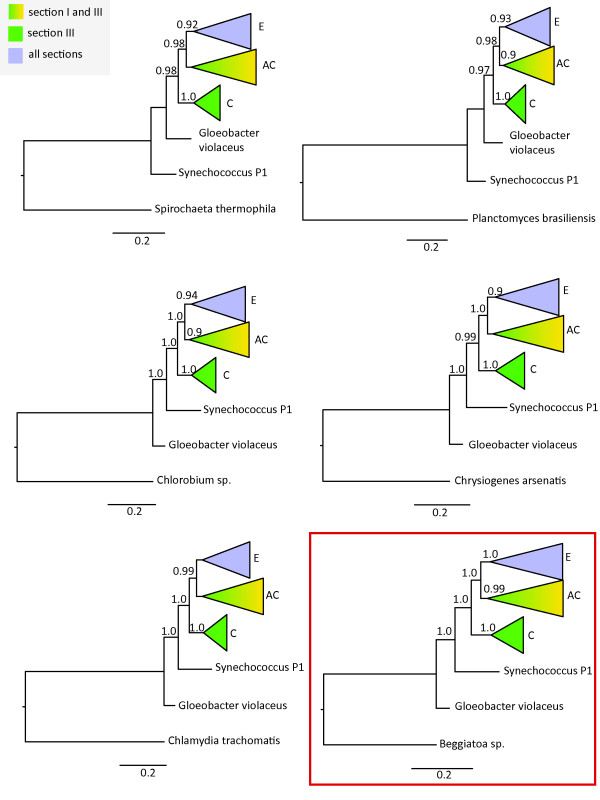
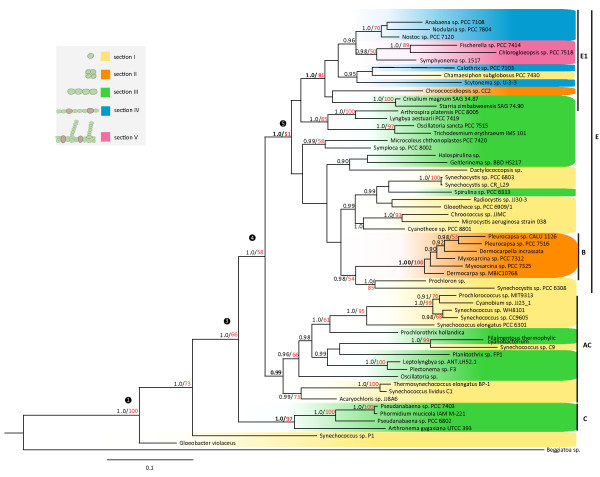
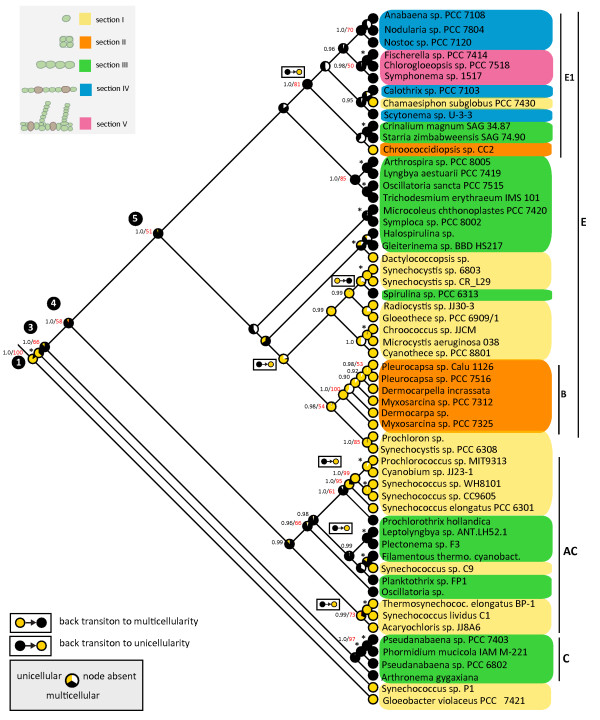
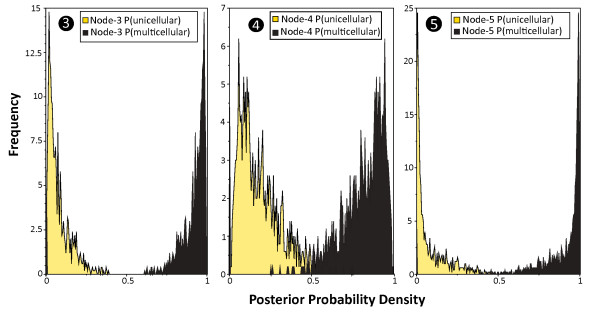
Results: We conducted and compared phylogenetic analyses of 16S rDNA sequences from a large sample of taxa representing the morphological and genetic diversity of cyanobacteria. We reconstructed ancestral character states on 10,000 phylogenetic trees. The results suggest that the majority of extant cyanobacteria descend from multicellular ancestors. Reversals to unicellularity occurred at least 5 times. Multicellularity was established again at least once within a single-celled clade. Comparison to the fossil record supports an early origin of multicellularity, possibly as early as the "Great Oxygenation Event" that occurred 2.45-2.22 billion years ago.

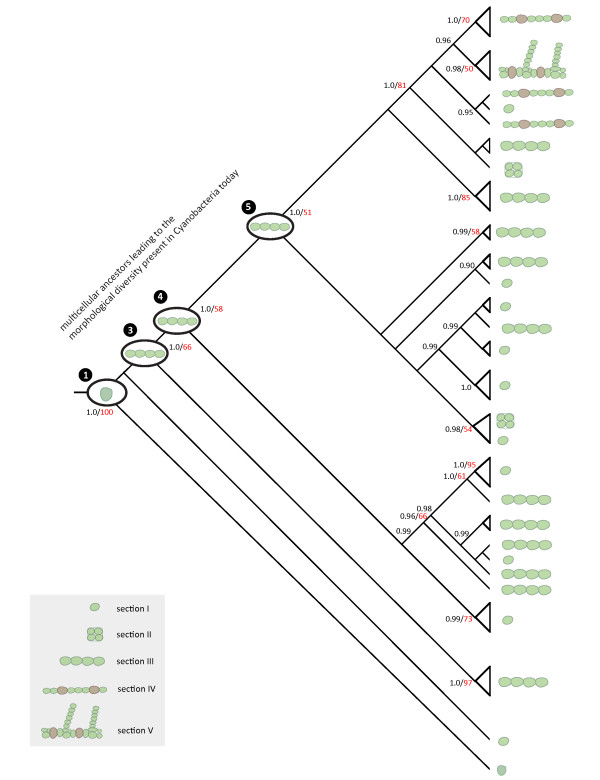
Conclusions: The results indicate that a multicellular morphotype evolved early in the cyanobacterial lineage and was regained at least once after a previous loss. Most of the morphological diversity exhibited in cyanobacteria today--including the majority of single-celled species--arose from ancient multicellular lineages. Multicellularity could have conferred a considerable advantage for exploring new niches and hence facilitated the diversification of new lineages.


Figures

Figure 1
Figure 1
Phylogenetic tree of 1,254 cyanobacterial species. Maximum likelihood phylogram of cyanobacteria, based on GTR+G+I substitution model. Six eubacterial species form an outgroup. The ingroup contains 1,254 cyanobacterial strains and six different chloroplast sequences. Bootstrap values (> 50%) calculated from 100 re-samplings are displayed at the nodes. Colors define major morphological characters in the groups. Yellow are single-celled cyanobacteria of section I; orange single-celled from section II; green are multicellular, undifferentiated cyanobacteria from section III; blue are multicellular and differentiated bacteria from section IV; and pink from section V. Sections as described by Castenholz 2001 [9]. Different sub-groups (AC1;A1-A5;B1, B2;C1-C4;D1-D2) are defined for the phylogeny. Nomenclature of groups correlates with morphological sections as illustrated in the legend. From these sub-groups taxa were sampled for further analyses. A complete list with species included in the analysis can be found in Additional File 7.
Figure 2
Figure 2
Unrooted Bayesian consensus tree of Eubacteria including five cyanobacterial species. Unrooted phylogenetic tree of 16S rRNA gene sequences from 27 eubacterial species reconstructed using Bayesian methods. Posterior probabilities (black) and bootstrap values (red) from 100 re-samplings are displayed at the nodes. Cyanobacteria, represented by 5 species, form a monophyletic group with Gloeobacter violaceus being closest to other eubacterial species.
Figure 3
Figure 3
Bayesian consensus trees of cyanobacterial subset using dierent eubacterial outgroups. Six out of 22 phylogenetic trees reconstructed with Bayesian inference. For each tree an outgroup from a different eubacterial phylum was chosen. Posterior probabilities are displayed at the nodes. Green color represents multicellular cyanobacteria from section III, green-yellow gradient covers species from unicellular section I and multicellular section III, and purple depicts all five different morphological sections present in cyanobacteria. The majority of outgroups exhibits a similar tree topology. For further analyses Beggiatoa sp. was selected as an outgroup.
Figure 4
Figure 4
Phylogenetic tree of a cyanobacterial subset. Bayesian consensus cladogram of 16S rDNA sequences from 58 cyanobacterial strains, based on GTR+G+I substitution model, with Beggiatoa sp. used as outgroup. Posterior probabilities (> 0.9) are shown in black at nodes and bootstrap values (> 50%) in red. Posterior probabilities were calculated from 265,858 trees and bootstrap values from 500 re-samplings of the original data set. Colors define groups: yellow are single-celled cyanobacteria of section I; orange single-celled from section II; green are multicellular, undifferentiated cyanobacteria from section III; blue are multicellular and differentiated bacteria from section IV; and pink from section V. Sections as described by Castenholz 2001 [9]. AC, B, C, E and E1 denote phylogenetic clades described in the text.
Figure 5
Figure 5
Ancestral character state reconstruction using maximum likelihood. Ancestral character state reconstruction with maximum likelihood analysis, using the "Asymmetrical Markov k-state 2 parameter"(AsymmMk) model implemented in Mesquite 2.71 [60]. Transition rates were estimated by the program (Table 2). Analysis was run over 10,000 randomly sampled trees from the Bayesian analysis and plotted on the Bayesian consensus tree. Possible states are unicellular (yellow) and multicellular (black). Relative likelihood probabilities for each character state are represented with a pie chart at nodes. The white part in the pie charts indicates the fraction of trees where the node was absent. Posterior probabilities (black) and bootstrap values (red) from the phylogenetic analyses are displayed at the nodes. Asterisks denote supported nodes for which posterior probabilities and bootstrap values are presented in Figure 4. At nodes 3, 4 and 5 a multicellular ancestry is very likely. Back mutations to unicellularity occur at least five times. A back mutation to multicellularity occurs at least once. Clades where transitions occurred are labelled.
Figure 6
Figure 6
Ancestral character states of nodes 3, 4 and 5 using Bayesian analysis. Posterior probability distribution for a unicellular character state (yellow) and a multicellular character state (black) at nodes 3, 4 and 5 from 10,000 Bayesian trees. 2× 5,000 trees were randomly sampled from 2 MC3-searches. Analysis was performed using BayesTraits. Posterior distributions were derived from reversible jump MCMC-search of 30 million iterations using a hyperprior approach. The probability of a multicellular ancestry is shifted towards 1 for each of the three nodes.
Figure 7
Figure 7
Timeline with prokaryotic fossil record. Timeline with geological events (A) and prokaryotic fossil record (B). (A) Formation of Earth [118], first evidence of continental crust [119], formation of continents [118], and glaciation events described in the Snowball Earth hypothesis [120]. (B) The oldest conclusive cyanobacterial fossils are found in around 2.15 billion year old rocks. 1-7: Fossils from the Archean Eon [23,25,26,84-87]. 8: chroococcacean fossils [24]; 9: oscillatorian fossils [24]. I-V: cyanobacterial fossils [18-20]. 10: eukaryotic fossils [65].
Figure 8
Figure 8
Schematic illustration of cyanobacterial evolution. Numbers at the nodes indicate Bayesian posterior probabilities (black) and bootstrap values (red) from the phylogenetic analyses. The most recent common ancestor of all cyanobacteria is optimized to have been unicellular. All cyanobacteria derive from a unicellular most recent common ancestor (node 1). The lineage leading to Gloeobacter violaceus diverges very early from the remaining cyanobacteria. Most major clades of cyanobacteria derive from multicellular ancestors (nodes 3-5).

References

    1. Blankenship RE. Molecular Mechanisms of Photosynthesis. Blackwell Science, Oxford; 2002.
    1. Bekker A, Holland HD, Wang PL, Rumble D, Stein HJ, Hannah JL, Coetzee LL, Beukes NJ. Dating the rise of atmospheric oxygen. Nature. 2004;427(6970):117–120. doi: 10.1038/nature02260. - DOI - PubMed
    1. Kopp RE, Kirschvink JL, Hilburn IA, Nash CZ. The paleoproterozoic snowball Earth: A climate disaster triggered by the evolution of oxygenic photosynthesis. Proceedings Of The National Academy Of Sciences Of The United States Of America. 2005;102(32):11131–11136. doi: 10.1073/pnas.0504878102. - DOI - PMC - PubMed
    1. Tomitani A, Knoll AH, Cavanaugh CM, Ohno T. The evolutionary diversification of cyanobacteria: Molecular-phylogenetic and paleontological perspectives. Proceedings Of The National Academy Of Sciences Of The United States Of America. 2006;103(14):5442–5447. doi: 10.1073/pnas.0600999103. - DOI - PMC - PubMed
    1. Allen JF, Martin W. Evolutionary biology: Out of thin air. Nature. 2007;445:610–612. doi: 10.1038/445610a. - DOI - PubMed

LinkOut - more resources