Comment
. 2011 Jul 1;57(1):5-14.
doi: 10.1016/j.neuroimage.2011.01.079. Epub 2011 Feb 23.

Accurate measurement of brain changes in longitudinal MRI scans using tensor-based morphometry

Affiliations
Comment

Accurate measurement of brain changes in longitudinal MRI scans using tensor-based morphometry

Xue Hua et al. Neuroimage. .

Abstract

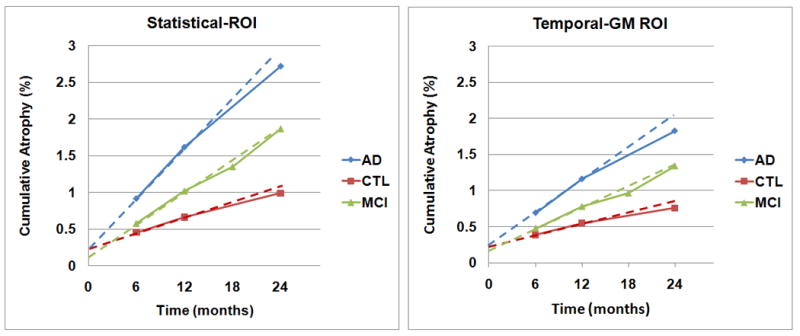
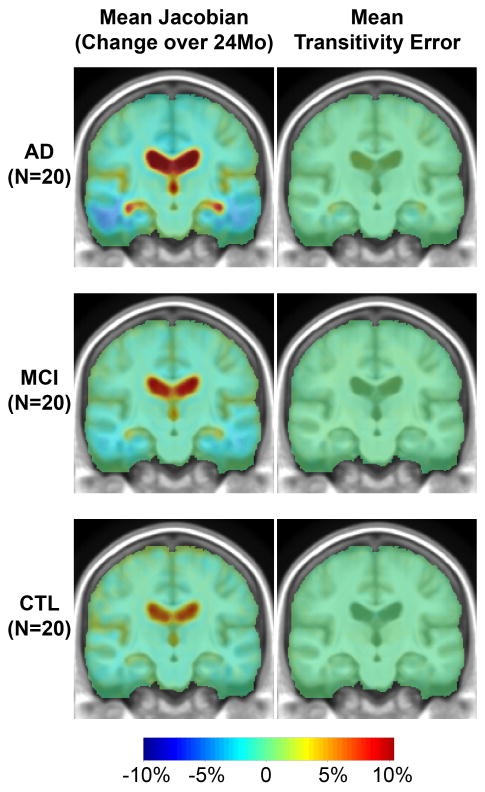
This paper responds to Thompson and Holland (2011), who challenged our tensor-based morphometry (TBM) method for estimating rates of brain changes in serial MRI from 431 subjects scanned every 6 months, for 2 years. Thompson and Holland noted an unexplained jump in our atrophy rate estimates: an offset between 0 and 6 months that may bias clinical trial power calculations. We identified why this jump occurs and propose a solution. By enforcing inverse-consistency in our TBM method, the offset dropped from 1.4% to 0.28%, giving plausible anatomical trajectories. Transitivity error accounted for the minimal remaining offset. Drug trial sample size estimates with the revised TBM-derived metrics are highly competitive with other methods, though higher than previously reported sample size estimates by a factor of 1.6 to 2.4. Importantly, estimates are far below those given in the critique. To demonstrate a 25% slowing of atrophic rates with 80% power, 62 AD and 129 MCI subjects would be required for a 2-year trial, and 91 AD and 192 MCI subjects for a 1-year trial.


Figures

Figure 1
Figure 1
TBM-derived summaries of cumulative atrophy in 91 AD, 188 MCI and 152 normal control subjects, based on a statistical region of interest in the temporal lobes (using summary data from Hua et al., 2010; see methods for details). If the 6-12 month change is extrapolated back to the origin, there is an apparent non-zero offset that appears to shift the measures upward by about 1.2-1.4%; a linear regression fitted to all time points would give a smaller offset. The biological trajectory may not be linear over time, but algorithmic sources contributing to this offset are explained and analyzed in this paper. We later show that this offset is reduced to 0.28% using the proposed implementation of inverse-consistent registration to compute the brain changes. The residual (much smaller) offset may be attributed to transitivity errors as well as sampling and biological nonlinearity, as there is no reason to expect the changes to be perfectly linear and to have zero intercept.
Figure 2
Figure 2. Measures of inverse consistency
(a) Map of inverse consistency error. The inverse consistency error is less than a few thousandths of a millimeter, except outside the brain, in a typical, representative mapping from a control individual scanned twice with a 12-month interval. (b) Map of ||Dh| |D(inv(h−1)||, for the image in (a). On average, the error within the brain is on the order of 0.1% change, likely to be reduced during Jacobian integration over an ROI. Thus, ICE is unlikely to be the major factor contributing to the remaining nonlinearity in the data, which is very small and may reflect sampling, biological nonlinearities, or other factors. (c) Map of relative inverse consistency error, ICE/‖u‖. Relative error is under 5%, and much lower in the vast majority of the image. This upper bound on the inverse consistency error is well below 5% of the measured displacement all over the brain, regardless of whether the displacement is small or large.
Figure 3
Figure 3
With inverse-consistent registration, the offset is greatly reduced, to around 0.1-0.3% for a statistical region of interest in the temporal lobes (left panel), and 0.15-0.25% for the temporal lobe gray matter (Temporal-GM; right panel). This offset is explainable in terms of statistical variability in the sample (Figure 4), and transitivity error, which is low (Figures 5 and 6). Cumulative atrophy in both ROIs is roughly linear. We do not expect numerical summaries in a pre-defined ROI to give entirely linear trajectories as the focus of atrophy defined at any one time point does not remain identical over time – it spreads out. For that reason, a statistical ROI based on the 1-year follow-up may catch greater atrophy over intervals that lie within that one year, and lesser ongoing atrophy thereafter; to boost statistical power, it is created with a deliberate selection approach to detect voxels with greatest atrophy occurring over one year. In ADNI, controls and AD patients are not scanned at the 18-month time-point.
Figure 4
Figure 4
Cumulative atrophy shows a linear trend in controls (n=152) - the same data set of controls as used in Figure 3. The black line shows the best linear fit to all the data points using linear mixed effects model. The top panels are based on measures of cumulative atrophy at 6, 12, and 24 months inside the statistical ROI (a) and temporal lobe gray matter (b). Regressions in this first row leave out the known data point of zero change at baseline, to see what intercept would be inferred from the other data points. The bottom panels (c), (d) include the known data point at baseline (where the change is zero by definition) but do not force the line through the origin. Intercept estimates are (a) statistical ROI: 0.29% (95% CI [0.15, 0.44]), (b) temporal lobe gray matter: 0.28% (95% CI [0.15, 0.42]), (c) statistical ROI including the known data point at baseline: 0.12% (95% CI [0.05, 0.19]), (d) temporal lobe gray matter including the known data point at baseline: 0.11% (95% CI [0.04, 0.18]). The red dotted lines show the 95% confidence interval of the regression line. The plots are generated by R using the lme4 package. This plot demonstrates the heterogeneity of any biological sample. Some outliers may influence the intercept (see the lowest and highest points at 6 months).
Figure 5
Figure 5. Transitivity error is small and sufficient to account for the remaining intercept of up to 0.3%
Here we show maps of the average change over 2 years. Blue colors (top left) show cumulative atrophy of around 2-10% in AD, and red colors show ventricular expansion of around 10%. The transitivity error map is typically around 0.2-0.3%, accounting for under one tenth of the signal; regional summaries are shown in Figure 6. The transitivity error is generally positive, showing that the direct mapping (which is used to estimate atrophy) shows slightly less change than the composition of mappings from 0 to 12, and 12 to 24 months. This is natural, as there will be some errors associated with each of the components of the composed mappings. There may also be biological departure from perfect linearity in the anatomical deformations, making the direct mapping to the 2-year time point shorter than constructing the mapping via the 1-year time-point.
Figure 6
Figure 6
Transitivity Errors (TE) plotted versus the true change (true change = J(hAC)-TE) in both temporal lobe and statistical ROIs. The transitivity error (y-axis) is plotted on a scale 10 times smaller than the true change (x-axis). This error is typically a very small contributor to the overall change, with typical values of around 0.2%-0.3%, or 7-10% of the overall change. This small error accounts for the remaining offset in the data. Clearly, the TE is weakly correlated with the true change, so subtracting it may even reduce the discriminative power of the measures. It can be eliminated with highly CPU-intensive group-wise registration schemes (see Discussion).

Comment on

References

    1. Ashburner J. A fast diffeomorphic image registration algorithm. Neuroimage. 2007;38(1):95–113. 15. - PubMed
    1. Avants B, Cook PA, McMillan C, Grossman M, Tustison NJ, Zheng Y, Gee JC. Sparse unbiased analysis of anatomical variance in longitudinal imaging. Med Image Comput Comput Assist Interv. 2010;13(Pt 1):324–31. - PMC - PubMed
    1. Braak H, Braak E. Neuropathological stageing of Alzheimer-related changes. Acta Neuropathol; (Berl) 1991;82(4):239–59. - PubMed
    1. Cachier P, Rey D. Symmetrization of the Non-Rigid Registration Problem using Invertion-Invariant Energies: Application to Multiple Sclerosis. Proc of MICCAI 2000. 2000:472–481. October 2000.
    1. Carlson NE, Moore MM, Dame A, Howieson D, Silbert LC, Quinn JF, Kaye JA. Trajectories of brain loss in aging and the development of cognitive impairment. Neurology. 2008;70:828–33. - PubMed

LinkOut - more resources