

Allergy-related outcomes in relation to serum IgE: results from the National Health and Nutrition Examination Survey 2005-2006
- PMID: 21320720
- PMCID: PMC3108140
- DOI: 10.1016/j.jaci.2010.12.1106
Allergy-related outcomes in relation to serum IgE: results from the National Health and Nutrition Examination Survey 2005-2006
Abstract
Background: The National Health and Nutrition Examination Survey (NHANES) 2005-2006 was the first population-based study to investigate levels of serum total and allergen-specific IgE in the general US population.
Objective: We estimated the prevalence of allergy-related outcomes and examined relationships between serum IgE levels and these outcomes in a representative sample of the US population.
Methods: Data for this cross-sectional analysis were obtained from NHANES 2005-2006. Study subjects aged 6 years and older (n = 8086) had blood taken for measurement of total IgE and 19 specific IgE levels against common aeroallergens, including Alternaria alternata, Aspergillus fumigatus, Bermuda grass, birch, oak, ragweed, Russian thistle, rye grass, cat dander, cockroach, dog dander, dust mite (Dermatophagoides farinae and Dermatophagoides pteronyssinus), mouse and rat urine proteins, and selected foods (egg white, cow's milk, peanut, and shrimp). Serum samples were analyzed for total and allergen-specific IgE by using the Pharmacia CAP System. Information on allergy-related outcomes and demographics was collected by questionnaire.
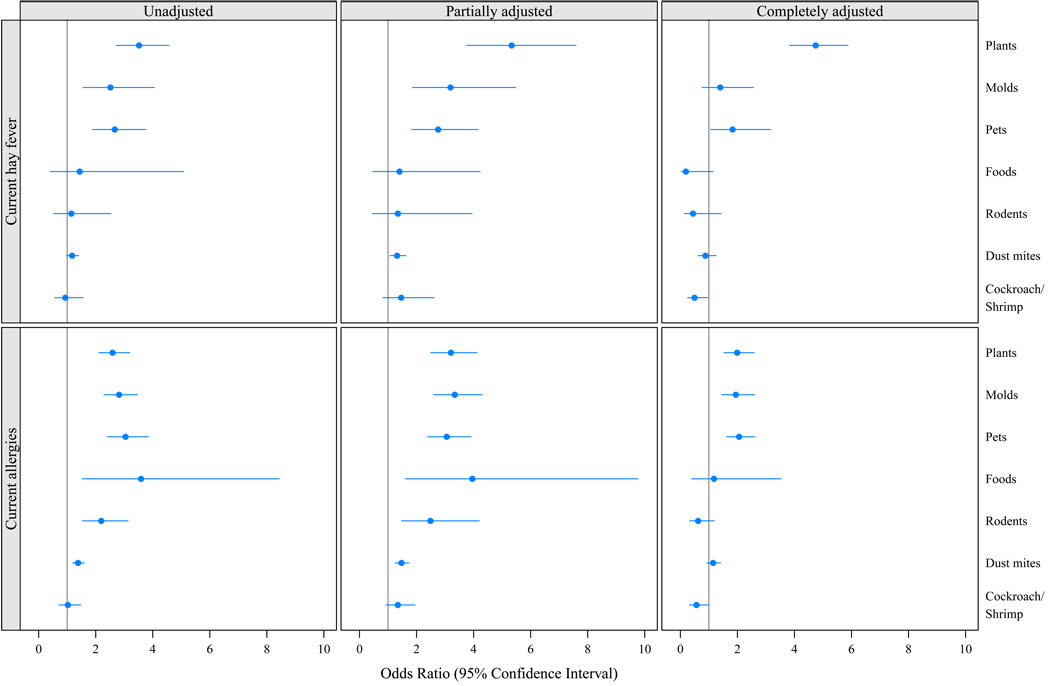
Results: In NHANES 2005-2006, 6.6% reported current hay fever, and 23.5% had current allergies. Allergy-related outcomes increased with increasing total IgE levels (adjusted odds ratios for a 10-fold increase in total IgE level of 1.86 [95% CI, 1.44-2.41] for hay fever and 1.64 [95% CI, 1.41-1.91] for allergies). Increased levels of plant-, pet-, and mold-specific IgE contributed independently to allergy-related symptoms. The greatest increase in odds was observed for hay fever and plant-specific IgE (adjusted odds ratio, 4.75; 95% CI, 3.83-5.88).
Conclusion: In the US population self-reported allergy symptoms are most consistently associated with increased levels of plant-, pet-, and mold-specific IgE.
Published by Mosby, Inc.
Figures
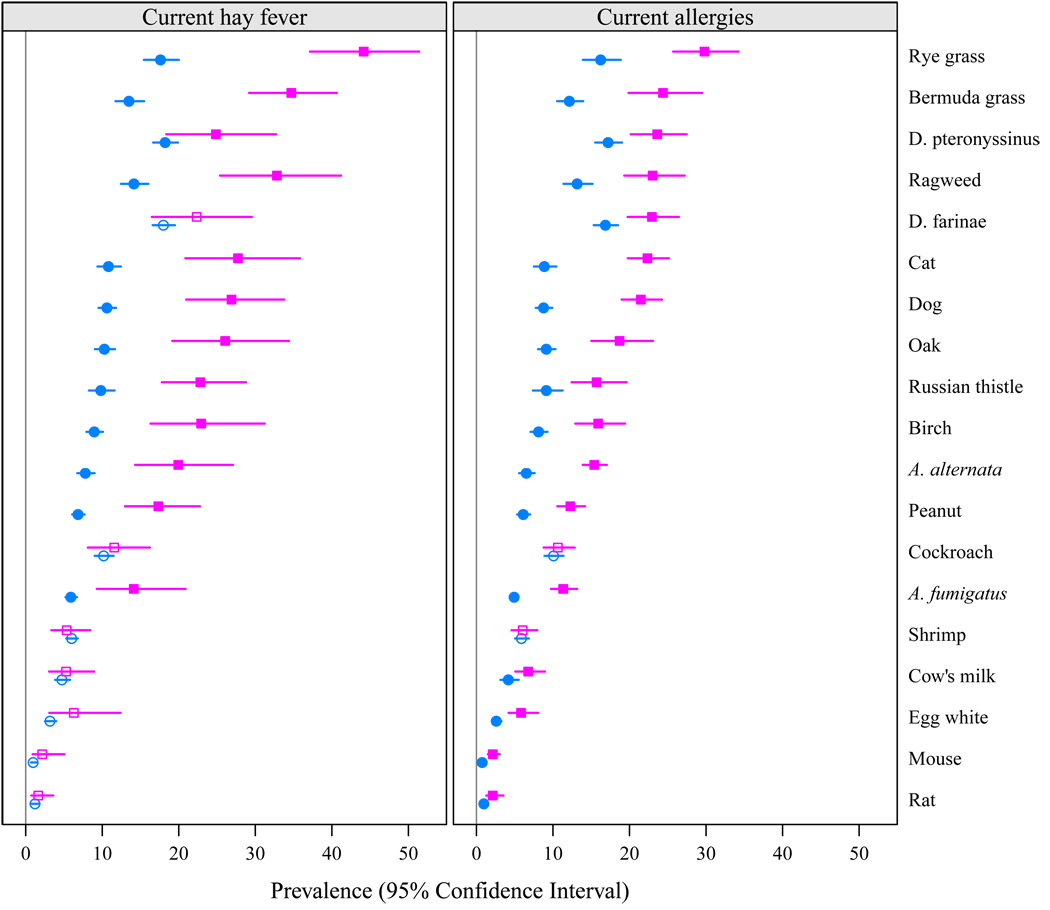
 ) and among those without these primary outcomes (
 ). Closed symbols represent statistically significant differences, whereas prevalences that are not statistically different are marked with open symbols.
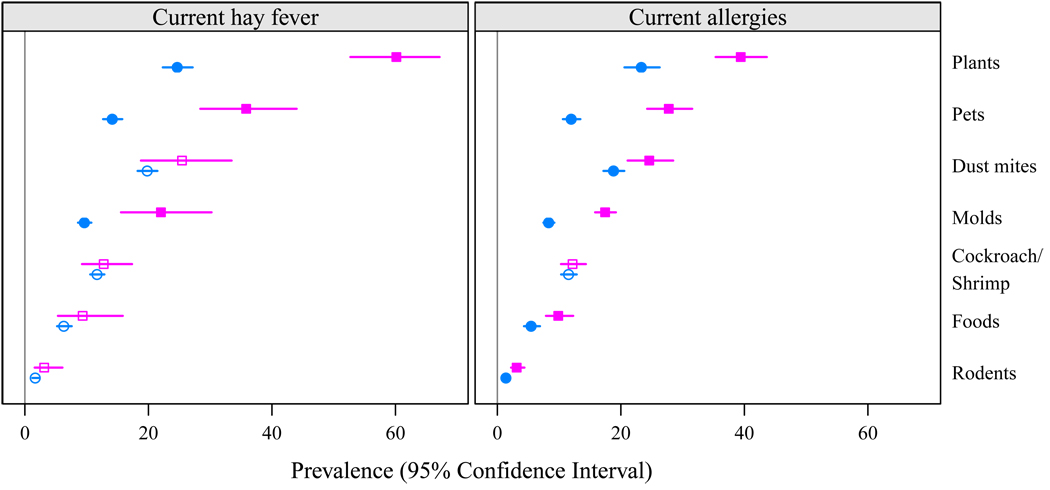 ) and among those without these primary outcomes (). Closed symbols represent statistically significant differences, whereas prevalences that are not statistically different are marked with open circles.
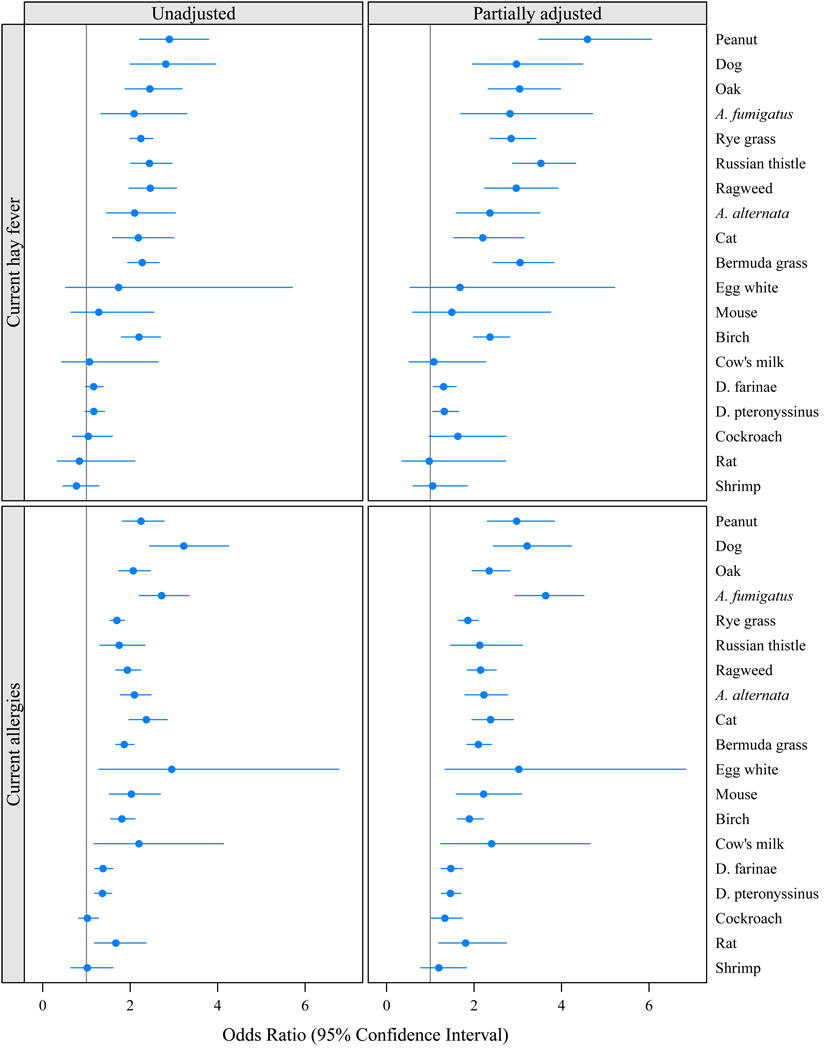
References
-
- Arbes SJ, Jr, Gergen PJ, Elliott L, Zeldin DC. Prevalences of positive skin test responses to 10 common allergens in the US population: results from the third National Health and Nutrition Examination Survey. J Allergy Clin Immunol. 2005;116:377–383. - PubMed
-
- Bloom B, Cohen RA. Summary health statistics for U.S. children: National Health Interview Survey, 2006. Vital Health Stat. 2007;10(234) - PubMed
-
- Bloom B, Dey AN, Freeman G. Summary health statistics for U.S. children: National Health Interview Survey, 2005. Vital Health Stat. 2006;10(231) - PubMed
-
- Pleis JR, Lethbridge-Cejku M. Summary health statistics for U.S. adults: National Health Interview Survey, 2005. Vital Health Stat. 2006;10(232) - PubMed
-
- Pleis JR, Lethbridge-Cejku M. Summary health statistics for U.S. adults: National Health Interview Survey, 2006. Vital Health Stat. 2007;10(235) - PubMed
Publication types
MeSH terms
Substances
Grants and funding
LinkOut - more resources
Full Text Sources
Other Literature Sources
Medical
Miscellaneous
