. 2011 Apr;79(4):1759-69.
doi: 10.1128/IAI.01373-10. Epub 2011 Feb 14.

Impact of salmonella infection on host hormone metabolism revealed by metabolomics

Affiliations

Impact of salmonella infection on host hormone metabolism revealed by metabolomics

L Caetano M Antunes et al. Infect Immun. 2011 Apr.

Abstract

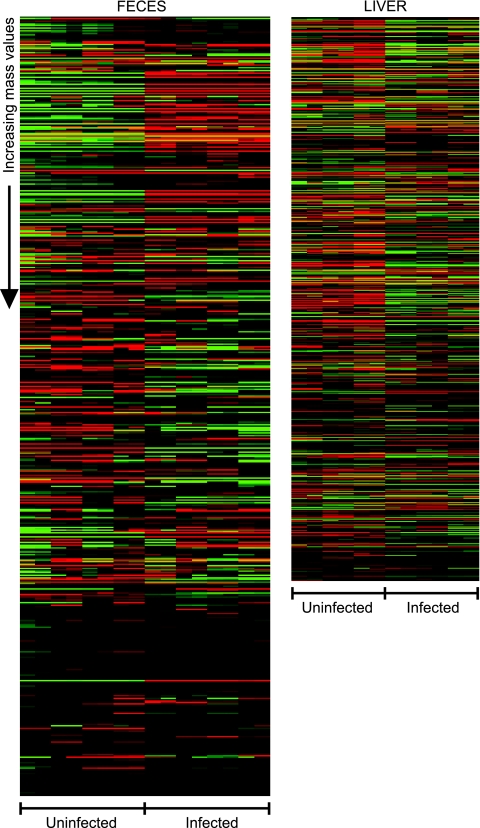
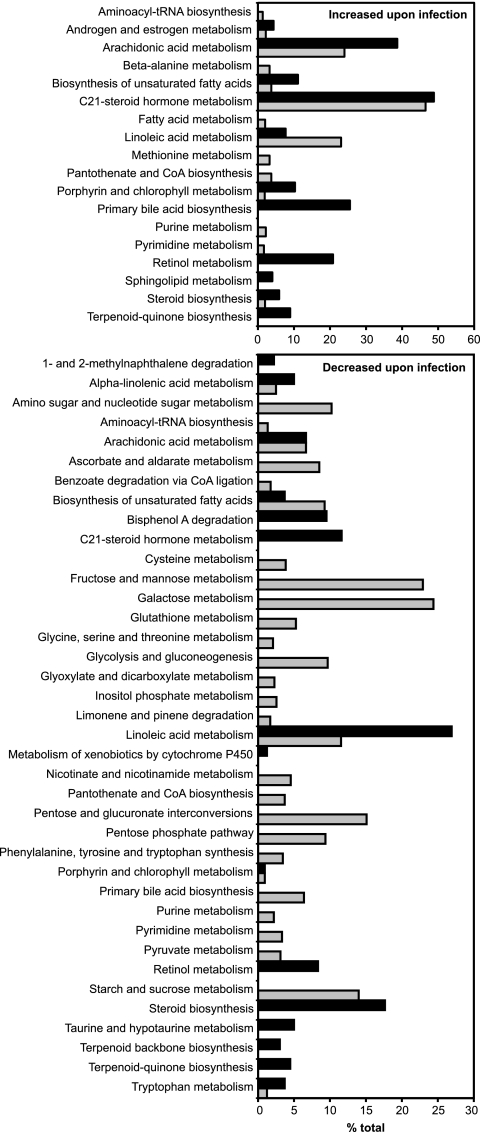
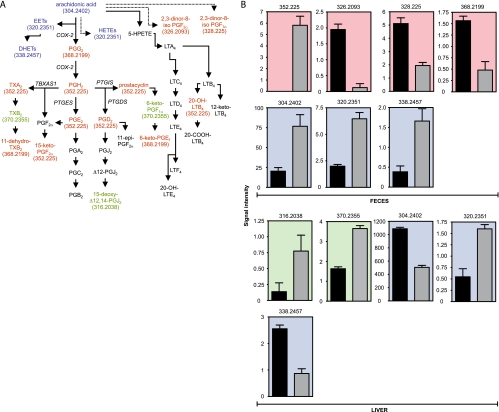
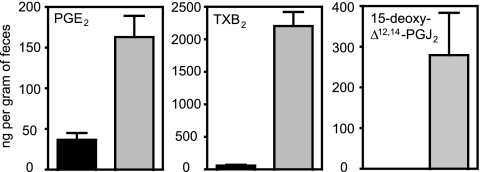
The interplay between pathogens and their hosts has been studied for decades using targeted approaches, such as the analysis of mutants and host immunological responses. Although much has been learned from such studies, they focus on individual pathways and fail to reveal the global effects of infection on the host. To alleviate this issue, high-throughput methods, such as transcriptomics and proteomics, have been used to study host-pathogen interactions. Recently, metabolomics was established as a new method to study changes in the biochemical composition of host tissues. We report a metabolomic study of Salmonella enterica serovar Typhimurium infection. Our results revealed that dozens of host metabolic pathways are affected by Salmonella in a murine infection model. In particular, multiple host hormone pathways are disrupted. Our results identify unappreciated effects of infection on host metabolism and shed light on mechanisms used by Salmonella to cause disease and by the host to counter infection.


Figures

FIG. 1.
FIG. 1.
Heat maps showing the effect of Salmonella infection (5 days) on the levels of metabolites from mouse feces and livers. Data were median centered using Cluster (7), and heat maps were constructed using Java TreeView (http://rana.lbl.gov/EisenSoftware.htm). Masses are presented from lowest (top) to highest (bottom). Green represents masses with signal intensities higher than the median, whereas red indicates signal intensities lower than the median. Black indicates missed values or values with no difference from the median signal intensity.
FIG. 2.
FIG. 2.
Metabolic pathways affected by Salmonella infection (5 days). Masses of interest were searched against the KEGG database using the MassTrix software (http://masstrix.org) (34). Bars indicate the percentage of metabolites from each KEGG pathway that was affected by infection. Black bars indicate metabolites from feces, and gray bars indicate metabolites from livers.
FIG. 3.
FIG. 3.
The effect of Salmonella infection on eicosanoid hormone metabolism. (A) Schematic of the eicosanoid hormone metabolic pathway. Colors indicate the organs in which a given hormone was affected by infection (5 days). Red indicates metabolites affected in feces, green indicates those affected in liver, and blue indicates those affected in both samples. Black indicates metabolites not detected or unchanged. Masses (Da) for metabolites affected are shown in parentheses. Solid arrows indicate direct steps, and dashed arrows indicate multiple steps that are not shown. Enzymes involved in some of the reactions displayed are shown in italics. (B) Levels of masses affected by infection (5 days) in the eicosanoid pathway. Masses are shown at the top of each graph. The y axis indicates mass signal intensity. Signal/noise ratios for metabolites shown varied between 14.2 and 14,641.2. Color scheme is the same as that described for panel A. Black bars represent uninfected samples, and gray bars indicate infected samples. Averages with standard errors of means are shown. Four samples were used for feces and three for livers, with duplicate measurements (n = 8 for feces and n = 6 for livers). Ions presumptively neutralized to a mass of 304.2402 Da using our method were detected in feces in both negative- and positive-ionization modes, and all results were used (n = 16). All P values were ≤0.0001, except for the metabolites in feces with masses of 338.2457 (P = 0.0023) and 304.2402 (P = 0.0008) Da and the metabolites in livers with masses of 316.2038 (P = 0.0492) and 320.2351 (P = 0004) Da. PG, prostaglandin; LT, leukotriene; TX, thromboxane; EET, epoxyeicosatrienoic acid; HETE, hydroxyeicosatetraenoic acid; HPETE, hydroperoxyeicosatetraenoic acid; DHET, dihydroxyeicosatrienoic acid.
FIG. 4.
FIG. 4.
Fecal levels of eicosanoids in uninfected (black bars) and infected (4 days; gray bars) samples, determined by ELISAs. Averages with standard errors of the means are shown. The numbers of uninfected mice used were 4 (15-deoxy-Δ12,14-PGJ2) and 5 (TBX2 and PGE2). The number of infected mice used was 4 in all cases. All differences were statistically significant (P < 0.05). Outliers were detected using the Grubbs' test and removed.
FIG. 5.
FIG. 5.
Relative transcript levels of enzymes involved in eicosanoid synthesis in uninfected (black bars) and infected (5 days; gray bars) livers. Averages of the results obtained from uninfected tissues were normalized to 1, and the levels for individual mice, uninfected and infected, were adjusted accordingly. Averaged results are shown. Bars indicate the standard errors of the means. Ten mice were used in all cases except for COX-2 determinations from uninfected mice (n = 7). All P values were <0.002, except for PTGDS (P = 0.0191) and PTGIS (P = 0.8963).
FIG. 6.
FIG. 6.
Transcript levels of COX-2 (diamonds) and 3βHSD2 (squares) in mouse livers throughout the course of Salmonella infection. Averages of the results obtained from uninfected tissues were normalized to 1, and the levels for individual mice, uninfected and infected, were adjusted accordingly. Averaged results are shown. Bars indicate the standard errors of the means. Numbers of mice used for COX-2 determinations were 7 (day 0), 3 (day 1), 3 (day 2), and 4 (day 3). Numbers of mice used for 3βHSD2 determinations were 10 (day 0), 4 (day 1), 4 (day 2), and 4 (day 3). Compared to results from uninfected samples (day 0), data from days 1 and 2 were not statistically significant (P > 0.05). Data from day 3 were statistically significant for both 3βHSD2 (P = 0.0351) and COX-2 (P = 0.0025).
FIG. 7.
FIG. 7.
The effect of Salmonella infection on steroid hormone metabolism. (A) Schematic of the C21 steroid hormone metabolic pathway. Colors indicate the organs in which a given hormone was affected by infection (5 days). Color coding is the same as that described for Fig. 2. The outer and inner membranes mentioned are mitochondrial. Masses (Da) for metabolites affected are shown in parentheses. Solid arrows indicate direct steps, and dashed arrows indicate multiple steps that are not shown. Enzymes involved in some of the reactions displayed are shown in italics. (B) Levels of masses affected by infection (5 days) in the steroid pathway. Masses are shown at the top of each graph. The y axis indicates mass signal intensity. Signal/noise ratios for the metabolites shown varied between 7.4 and 125.9. Color coding is the same as that described for Fig. 2. Black bars represent uninfected samples, and gray bars indicate infected samples. Averages with standard errors of the means are shown. Four samples were used for feces and three for livers, with duplicate measurements (n = 8 for feces and n = 6 for livers). Ions presumptively neutralized to masses of 362.2093 and 364.225 Da using our method were detected in livers in both negative- and positive-ionization modes, and all results were used (n = 12). All P values were ≤0.0001, except for the metabolite with a mass of 364.225 Da in feces (P = 0.0065).
FIG. 8.
FIG. 8.
Fecal levels of steroids in uninfected (black bars) and infected (4 days; gray bars) samples, determined by ELISAs. Averages with standard errors of the means are shown. Results from five uninfected mice are shown. For infected samples, the number of mice was 4 for aldosterone and 3 for cortisol. All differences were statistically significant (P < 0.05). Outliers were detected using the Grubbs' test and removed.
FIG. 9.
FIG. 9.
Relative transcript levels of enzymes involved in steroid synthesis in uninfected (black bars) and infected (5 days; gray bars) livers. Averages of the results obtained from uninfected tissues were normalized to 1, and the levels for individual mice, uninfected and infected, were adjusted accordingly. Averaged results are shown. Bars indicate the standard errors of the means. Ten mice were used in all cases except for StAR determinations from uninfected mice (n = 7) and 3βHSD2 determinations from infected mice (n = 8). P values were <0.002, except for StAR (P = 0.6972).
FIG. 10.
FIG. 10.
Salmonella infection disrupts steroid and eicosanoid metabolism in vitro. (A) Pregnenolone and cocultures of macrophages (RAW 264.7) and hepatocytes (AML12) increase 3βHSD2 expression. Cells were grown with (+) or without (−) 10 μM pregnenolone. The average of the relative mRNA levels in cultured hepatocytes with no additions was normalized to 1, and individual results for all treatments were adjusted accordingly. Averages with standard errors are shown. In all groups, the number of mice used was 6. Pregnenolone addition caused a significant increase in 3βHSD2 expression in hepatocytes (P = 0.0048) and cocultures (P < 0.0001) but not in macrophages (P = 0.6648). Coculturing caused a statistically significant increase in 3βHSD2 expression compared with that of macrophages or hepatocytes, with or without the addition of pregnenolone (all P values of <0.0001). Cells were incubated under each condition for 20 h. (B) Salmonella infection represses 3βHSD2 expression during coculture of macrophages and hepatocytes in the presence of pregnenolone. Averages of the relative mRNA levels in uninfected wells (time zero) were normalized to 1, and the results for individual wells, uninfected and infected, were adjusted accordingly. Averages and standard errors of the means are shown. Five wells were used for the first time point (time zero), and three wells were used for all other time points. Comparisons of the 4-h, 6-h, and 8-h time points with time zero yielded P values of <0.0005. The difference between the 0-h and 2-h time points was not statistically significant (P = 0.5178). (C) Salmonella infection induces COX-2 expression during coculture of macrophages and hepatocytes in the presence of pregnenolone. Averages of the relative mRNA levels in uninfected wells (time zero) were normalized to 1, and the results for individual wells, uninfected and infected, were adjusted accordingly. Averaged results are shown. Bars indicate the standard errors of the means. Five wells were used for the first time point (time zero), and three wells were used for all other time points. Comparisons between the 0-h time point and all other time points yielded P values of <0.0001.

References

    1. Antunes, L. C. M., et al. 7 February 2011. The effect of antibiotic treatment on the intestinal metabolome. Antimicrob. Agents Chemother. doi:10.1128/AAC.01664-10. - DOI - PMC - PubMed
    1. Bearson, B. L., and S. M. Bearson. 2008. The role of the QseC quorum-sensing sensor kinase in colonization and norepinephrine-enhanced motility of Salmonella enterica serovar Typhimurium. Microb. Pathog. 44:271-278. - PubMed
    1. Calder, P. C. 2009. Polyunsaturated fatty acids and inflammatory processes: new twists in an old tale. Biochimie 91:791-795. - PubMed
    1. Cooles, P. 1986. Adjuvant steroids and relapse of typhoid fever. J. Trop. Med. Hyg. 89:229-231. - PubMed
    1. Daynes, R. A., B. A. Araneo, J. Hennebold, E. Enioutina, and H. H. Mu. 1995. Steroids as regulators of the mammalian immune response. J. Investig. Dermatol. 105:14S-19S. - PubMed

Publication types

Associated data