. 2011 Mar 1;108(9):3677-82.
doi: 10.1073/pnas.1100213108. Epub 2011 Feb 14.

Regulatory T-cell expansion during chronic viral infection is dependent on endogenous retroviral superantigens

Affiliations

Regulatory T-cell expansion during chronic viral infection is dependent on endogenous retroviral superantigens

George A Punkosdy et al. Proc Natl Acad Sci U S A. .

Abstract

Regulatory T cells (Treg) play critical roles in the modulation of immune responses to infectious agents. Further understanding of the factors that control Treg activation and expansion in response to pathogens is needed to manipulate Treg function in acute and chronic infections. Here we show that chronic, but not acute, infection of mice with lymphocytic choriomeningitis virus results in a marked expansion of Foxp3(+) Treg that is dependent on retroviral superantigen (sag) genes encoded in the mouse genome. Sag-dependent Treg expansion was MHC class II dependent, CD4 independent, and required dendritic cells. Thus, one unique mechanism by which certain infectious agents evade host immune responses may be mediated by endogenous Sag-dependent activation and expansion of Treg.


Conflict of interest statement

The authors declare no conflict of interest.

Figures

Fig. 1.
Fig. 1.
Vβ5+Foxp3+ Treg expand specifically during chronic LCMV infection. (A) Kinetics of Foxp3 expression on C57BL/6 splenic CD4+CD8 T cells after LCMV Armstrong or clone 13 infection. Error bars represent the SD of the mean of at least four animals per time point. (B) Surface expression of activation or costimulatory/inhibitory markers on CD4+Foxp3+ cells from uninfected mice (gray) and mice infected with LCMV Armstrong (blue) or clone 13 (red) (22 dpi). (C) Expression of TCR Vβ segments on CD4+Foxp3+ or CD4+Foxp3 T cells after infection with LCMV Armstrong and clone 13 (25 dpi). (D) Absolute number of CD4+Foxp3+ T cells in the spleen of uninfected and clone 13-infected mice (17 dpi) showing the number of Vβ5+ and Vβ5 cells. (E) Surface expression of activation or costimulatory/inhibitory markers on CD4+Foxp3+Vβ5+ (green) or Vβ5 (purple) T cells after clone 13 infection (22 dpi).
Fig. 2.
Fig. 2.
Vβ5+Foxp3+ Treg preferentially expand from a preexisting population of Treg after LCMV infection. (A) CD4+GFP/Foxp3+ or GFP/Foxp3 T cells were FACS sorted from naïve CD45.2 reporter mice and transferred into naïve CD45.1 recipients 1 d before clone 13 infection. Control uninfected mice were transferred with identical numbers of cells. (B) GFP and Foxp3 expression on splenic CD4+ T cells from mice that received CD45.2+CD4+GFP/Foxp3 T cells (15 dpi). Endogenous (Left) or transferred (Right) cells are shown. Numbers represent the percentage of cells in each quadrant. (C) GFP and Vβ5 expression on splenic CD4+Foxp3+ T cells from mice that received CD45.2+CD4+GFP/Foxp3+ T cells (15 dpi). Endogenous (Left) or transferred (Right) are shown, and numbers represent the percentage of GFP or GFP+ cells, respectively. (D) Adult C57BL/6 mice were injected with 1 mg BrdU 7 dpi with clone 13, and splenic CD4+ T cells were analyzed 24 h later. Numbers represent percentage of cells in each quadrant.
Fig. 3.
Fig. 3.
Expansion of Vβ5+Foxp3+ Treg is MHC class II dependent but CD4 independent. Adult C57BL/6 Abβ−/− or CD4−/− mice were infected with LCMV clone 13, and spleens were harvested 18 dpi. (A) Top: Percentage of CD3+Foxp3+ T cells in Abβ−/− mice. Middle: Gated on the CD3+Foxp3+ cells from Top. Bottom: Vβ5 expression on CD4+CD8 (Left) and CD4CD8+ (Right) cells from Middle. (B) Analysis of cells from CD4−/− mice. Top and Middle: Gated as in A. Bottom: Vβ5 expression on CD4CD8 (Left) and CD4CD8+ (Right) cells from Middle. Histograms show cells from uninfected (gray) or clone 13-infected (red) mice. Numbers represent percentage of cells in each region or quadrant.
Fig. 4.
Fig. 4.
Chronic infection of BALB/c mice results in the expansion of Foxp3+ Treg populations that are thymically deleted in response to Mtv/I-E recognition. (A) TCR Vβ analysis of splenic CD4+ T cells from adult BALB/c mice infected with LCMV clone 13. (B) Surface expression of activation or costimulatory/inhibitory markers on CD4+Foxp3+Vβ12+ (green) or Vβ12 (purple) T cells after clone 13 infection (17 dpi).
Fig. 5.
Fig. 5.
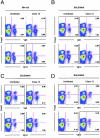
Expansion of thymically deleted Foxp3+ Treg in BALB/c mice is Mtv Sag dependent. (A) TCR Vβ analysis of splenic CD4+ T cells from adult BALB/c Mtv-null mice infected with LCMV clone 13. (B) TCR Vβ analysis of splenic CD4+ T cells from adult BALB/Mtv6 mice infected with LCMV clone 13. (C) TCR Vβ analysis of splenic CD4+ T cells from adult BALB/Mtv8 mice infected with LCMV clone 13. (D) TCR Vβ analysis of splenic CD4+ T cells from adult BALB/Mtv9 mice infected with LCMV clone 13. All mice were analyzed at 17 dpi. Numbers represent percentages of Foxp3+ or Foxp3 cells in each plot.
Fig. 6.
Fig. 6.
Mtv Sag-dependent Treg expansion requires DC. (A) Relative gene expression of Mtv sag genes in splenic MHC class II-enriched cells from uninfected BALB/c mice, BALB/c mice 8 dpi with either LCMV Armstrong or clone 13, and uninfected BALB/c Mtv-null mice. N.D., not detected. Error bars represent the SD of the mean of at least four animals per group. (B) Analysis of Vβ5-expressing Treg from B cell- (μMT) and Flt3L-deficient mice. Histograms are gated on CD4+Foxp3+ T cells from uninfected mice (gray) and mice infected with LCMV clone 13 (red; 17–20 dpi). (C) Depletion of DC in CD11c-DTR mice after DT treatment. Flow plots are gated on TCRβCD49b splenocytes. (D) Serum viral titers in clone 13-infected CD11c-DTR mice (17 dpi). Each circle represents a single mouse and the horizontal bar the mean. (E) Vβ5 analysis of splenic CD4+Foxp3+ cells from CD11c-DTR mice. Each circle represents a single mouse and the horizontal bar the mean. *P < 0.05. (F) Relative gene expression of Mtv sag genes in purified DC from uninfected BALB/c mice and BALB/c mice 8 dpi with either LCMV Armstrong or clone 13.

References

    1. Fontenot JD, Rudensky AY. A well adapted regulatory contrivance: Regulatory T cell development and the forkhead family transcription factor Foxp3. Nat Immunol. 2005;6:331–337. - PubMed
    1. Sakaguchi S. Naturally arising CD4+ regulatory t cells for immunologic self-tolerance and negative control of immune responses. Annu Rev Immunol. 2004;22:531–562. - PubMed
    1. Shevach EM. Mechanisms of foxp3+ T regulatory cell-mediated suppression. Immunity. 2009;30:636–645. - PubMed
    1. Bennett CL, et al. The immune dysregulation, polyendocrinopathy, enteropathy, X-linked syndrome (IPEX) is caused by mutations of FOXP3. Nat Genet. 2001;27:20–21. - PubMed
    1. Fontenot JD, Gavin MA, Rudensky AY. Foxp3 programs the development and function of CD4+CD25+ regulatory T cells. Nat Immunol. 2003;4:330–336. - PubMed

Publication types

MeSH terms

Substances