

Glass-like dynamics of collective cell migration
- PMID: 21321233
- PMCID: PMC3064326
- DOI: 10.1073/pnas.1010059108
Glass-like dynamics of collective cell migration
Abstract
Collective cell migration in tissues occurs throughout embryonic development, during wound healing, and in cancerous tumor invasion, yet most detailed knowledge of cell migration comes from single-cell studies. As single cells migrate, the shape of the cell body fluctuates dramatically through cyclic processes of extension, adhesion, and retraction, accompanied by erratic changes in migration direction. Within confluent cell layers, such subcellular motions must be coupled between neighbors, yet the influence of these subcellular motions on collective migration is not known. Here we study motion within a confluent epithelial cell sheet, simultaneously measuring collective migration and subcellular motions, covering a broad range of length scales, time scales, and cell densities. At large length scales and time scales collective migration slows as cell density rises, yet the fastest cells move in large, multicell groups whose scale grows with increasing cell density. This behavior has an intriguing analogy to dynamic heterogeneities found in particulate systems as they become more crowded and approach a glass transition. In addition we find a diminishing self-diffusivity of short-wavelength motions within the cell layer, and growing peaks in the vibrational density of states associated with cooperative cell-shape fluctuations. Both of these observations are also intriguingly reminiscent of a glass transition. Thus, these results provide a broad and suggestive analogy between cell motion within a confluent layer and the dynamics of supercooled colloidal and molecular fluids approaching a glass transition.
Conflict of interest statement
The authors declare no conflict of interest.
Figures
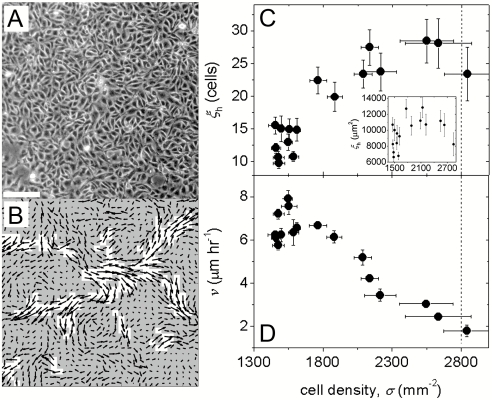
 as a function of cell density illustrates the analogy between motion within the cell monolayer and particulate supercooled fluids approaching a glass transition (C, blue line: AM equation fit, red line: VFT equation fit).
Comment in
- Proc Natl Acad Sci U S A. 108:4701.
References
-
- Friedl P, Hegerfeldt Y, Tusch M. Collective cell migration in morphogenesis and cancer. Int J Dev Biol. 2004;48:441–449. - PubMed
-
- Martin P, Parkhurst SM. Parallels between tissue repair and embryo morphogenesis. Development. 2004;131:3021–3034. - PubMed
-
- Lecaudey V, Gilmour D. Organizing moving groups during morphogenesis. Curr Opin Cell Biol. 2006;18:102–107. - PubMed
-
- Friedl P. Prespecification and plasticity: shifting mechanisms of cell migration. Curr Opin Cell Biol. 2004;16:14–23. - PubMed
-
- Szabo B, et al. Phase transition in the collective migration of tissue cells: experiment and model. Phys Rev E . 2006;74:061908. - PubMed
Publication types
MeSH terms
Grants and funding
LinkOut - more resources
Full Text Sources
Other Literature Sources
