. 2011 May;156(1):240-53.
doi: 10.1104/pp.110.170811. Epub 2011 Feb 14.

Phenotypic and genomic analyses of a fast neutron mutant population resource in soybean

Affiliations

Phenotypic and genomic analyses of a fast neutron mutant population resource in soybean

Yung-Tsi Bolon et al. Plant Physiol. 2011 May.

Abstract

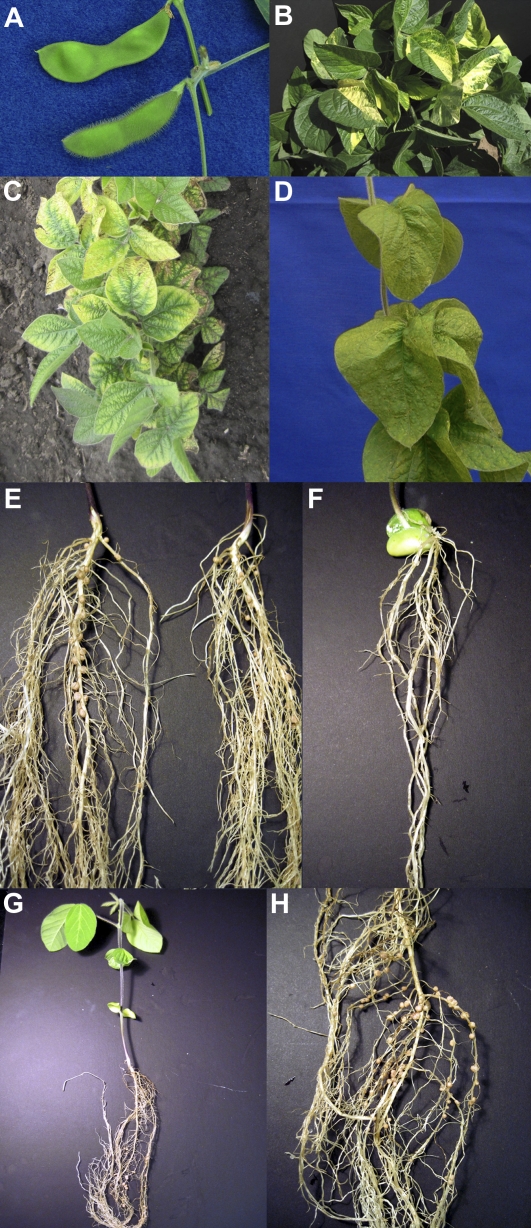
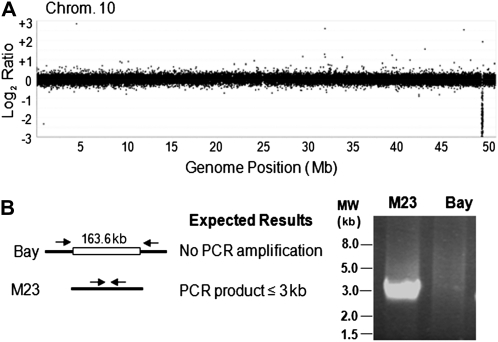
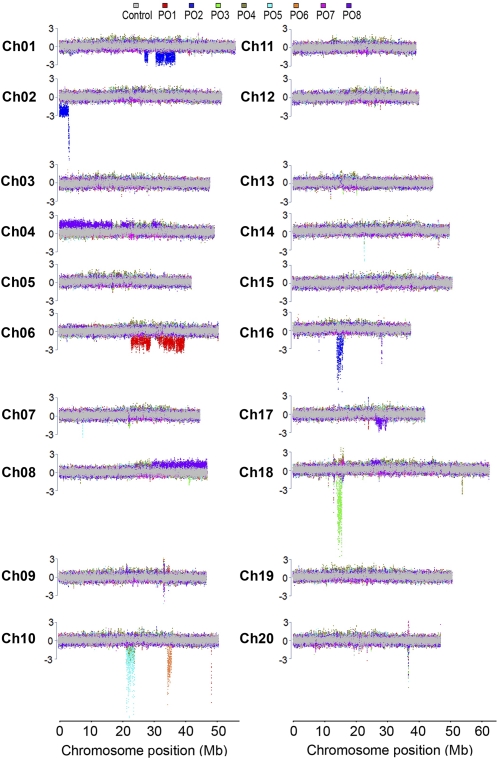
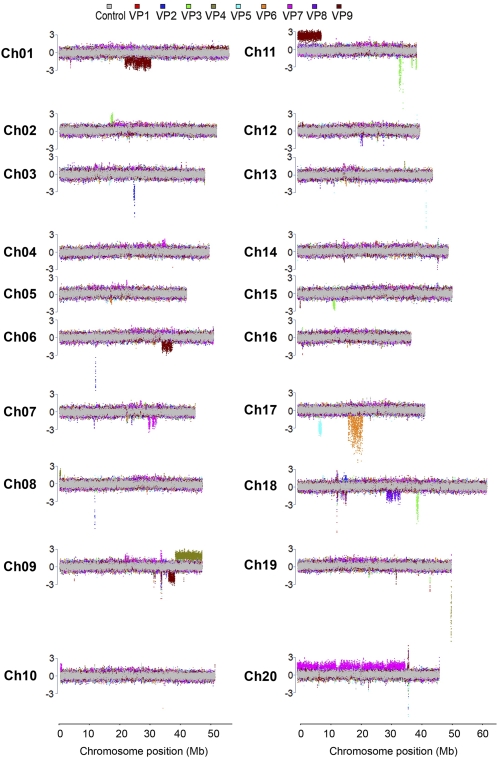
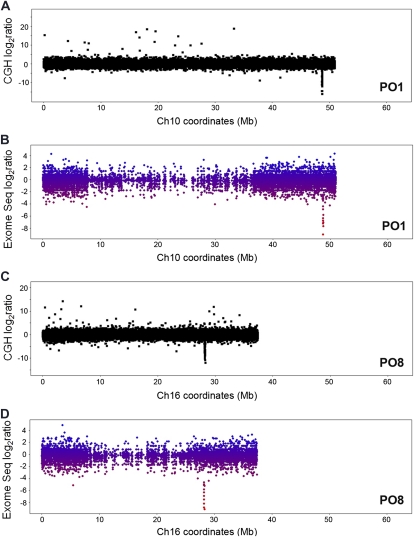
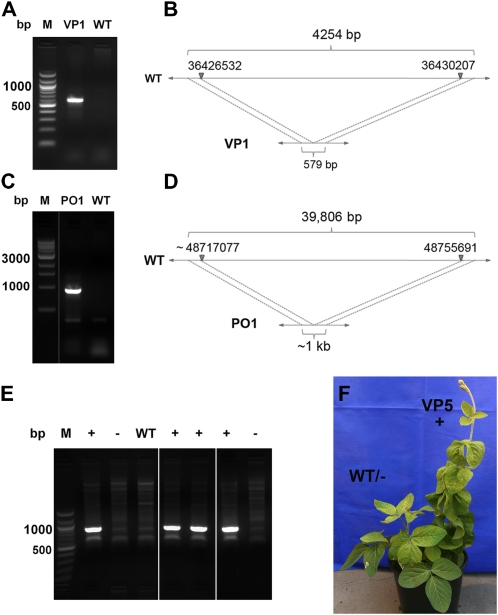
Mutagenized populations have become indispensable resources for introducing variation and studying gene function in plant genomics research. In this study, fast neutron (FN) radiation was used to induce deletion mutations in the soybean (Glycine max) genome. Approximately 120,000 soybean seeds were exposed to FN radiation doses of up to 32 Gray units to develop over 23,000 independent M2 lines. Here, we demonstrate the utility of this population for phenotypic screening and associated genomic characterization of striking and agronomically important traits. Plant variation was cataloged for seed composition, maturity, morphology, pigmentation, and nodulation traits. Mutants that showed significant increases or decreases in seed protein and oil content across multiple generations and environments were identified. The application of comparative genomic hybridization (CGH) to lesion-induced mutants for deletion mapping was validated on a midoleate x-ray mutant, M23, with a known FAD2-1A (for fatty acid desaturase) gene deletion. Using CGH, a subset of mutants was characterized, revealing deletion regions and candidate genes associated with phenotypes of interest. Exome resequencing and sequencing of PCR products confirmed FN-induced deletions detected by CGH. Beyond characterization of soybean FN mutants, this study demonstrates the utility of CGH, exome sequence capture, and next-generation sequencing approaches for analyses of mutant plant genomes. We present this FN mutant soybean population as a valuable public resource for future genetic screens and functional genomics research.


Figures

Figure 1.
Figure 1.
Selected soybean FN mutants with visual phenotypes. A, A short-trichome mutant, VP1 (top), displays short trichomes compared with wild-type soybean (bottom). B, A chimeric mutant, VP3, with altered leaf pigmentation patterns is visible among a field of other soybean mutants with normal pigmentation. C, A row of petite yellow-tinged mutants (VP4). D, The short-petiole and curled, crinkled leaf mutant (VP5). E, Wild-type root and nodules are shown at 3 weeks post germination. F, Mutant RN1 displays abnormal shoot-root connection and does not appear to nodulate. G, Robust mutant RN2 displays elongated internodes compared with the wild type and later begins pod set precociously. H, Hypernodulating mutant RN3 displays increased nodulation compared with the wild type in E.
Figure 2.
Figure 2.
Detection of a genomic deletion region encompassing a known deleted gene in M23. A, CGH analysis identifies a deletion at the end of chromosome 10. The y axis represents unaveraged log2 ratios of M23 to Bay hybridization signals. B, Confirmation of the predicted deletion by PCR. Arrows represent flanking amplification primers located 1.5 kb from the predicted 163.6-kb deletion.
Figure 3.
Figure 3.
CNV events detected by CGH in soybean FN seed protein and oil mutants. Full chromosome views of CNV events are depicted for all 20 soybean chromosomes. The normalized log2 ratios of sample to control data are plotted as the median across 11 probe data points across chromosome positions. Results from each array are color coded for mutants PO1 through PO8. PO1 to PO3 and PO8 = high seed protein; PO4 = low seed oil and high seed raffinose and Suc; PO5 = low seed oil; PO6 = low seed protein; PO7 = high seed oil. The gray overlay represents CGH data from control versus control hybridization. Colored regions above and below the control regions potentially represent copy number change differences. The y axis scale is in terms of the number of sd from average, with the segment threshold for deletions or duplications at ±3.
Figure 4.
Figure 4.
CNV events detected by CGH in soybean FN visual phenotype mutants. Full chromosome views of CNV events are depicted for all 20 soybean chromosomes. The normalized log2 ratios of sample to control data are plotted as the median across 11 probe data points across chromosome positions. Results from each array are color coded for mutants VP1 through VP9. VP1 and VP2, short trichomes; VP3, chimeric leaf pigmentation; VP4, petite and yellow leaf; VP5, short petiole and crinkled leaf; VP6, copper leaf; VP7, abnormal floral meristem development; VP8, fused trifoliates; VP9, thick, twisted petioles. The gray overlay represents CGH data from control versus control CGH. Colored regions above and below the control regions potentially represent copy number change differences. The y axis scale is in terms of the number of sd from average, with the segment threshold for deletions or duplications at ±3.
Figure 5.
Figure 5.
Exome resequencing confirms gene deletions detected by CGH. A, The corrected log2 ratios of sample PO1 to control intensities are shown for chromosome 10, where a deletion is detected at approximately 48.7 Mb. B, The normalized exome resequencing log2 ratios of sample PO1 to control exon counts are displayed for chromosome 10. Each colored dot represents an exon in a high-confidence gene call. The color gradient indicates the lowest (red) to highest (blue) amount of read count evidence for an exon in sample PO1 compared with the control. The absence of sequence evidence for exons at approximately 48.7 Mb is shown and parallels the deletion found by CGH in A. C, The corrected log2 ratios of sample PO8 to control intensities are shown for chromosome 16, where a deletion is detected at approximately 28.1 Mb. D, The normalized exome resequencing log2 ratios of sample PO8 to control exon counts are displayed for chromosome 10. Each colored dot represents an exon in a high-confidence gene call. The color gradient indicates the lowest (red) to highest (blue) amount of read count evidence for an exon in sample PO8 compared with the control. The absence of sequence evidence for exons at approximately 28.1 Mb is shown and parallels the deletion found by CGH in C.
Figure 6.
Figure 6.
Demarcation and confirmation of deletion regions and cosegregating phenotypes by PCR. A, Agarose gel electrophoresis of the PCR product across a deletion region in short-trichome mutant VP1 next to 100-bp marker (M) and wild-type (WT) M92-220 template PCR control lanes. B, A diagram shows the reference sequence region length (4,254 bp) versus the VP1 mutant region length (579 bp) characterized by PCR amplification and sequencing of the region. C, Agarose gel electrophoresis of the PCR product across a deletion region in high-seed protein mutant PO1 next to 1-kb marker and wild-type M92-220 template PCR control lanes. D, A diagram depicts the reference sequence region length (39,806 bp) versus the PO1 mutant region length (approximately 1 kb) characterized by PCR amplification and sequencing of the region. E, A deletion region on chromosome 17 was confirmed by PCR and mapped in VP5. This genetic marker locus in VP5 cosegregates with progeny displaying the short-petiole phenotype (+) and is not found in the wild type or in progeny without the short-petiole phenotype (−) shown in F.

References

    1. Alonso JM, Ecker JR. (2006) Moving forward in reverse: genetic technologies to enable genome-wide phenomic screens in Arabidopsis. Nat Rev Genet 7: 524–536 - PubMed
    1. Alonso JM, Stepanova AN, Solano R, Wisman E, Ferrari S, Ausubel FM, Ecker JR. (2003) Five components of the ethylene-response pathway identified in a screen for weak ethylene-insensitive mutants in Arabidopsis. Proc Natl Acad Sci USA 100: 2992–2997 - PMC - PubMed
    1. Alt JL, Fehr WR, Welke GA, Sandhu D. (2005) Phenotypic and molecular analysis of oleate content in the mutant soybean line M23. Crop Sci 45: 1997–2000
    1. Altschul SF, Gish W, Miller W, Myers EW, Lipman DJ. (1990) Basic local alignment search tool. J Mol Biol 215: 403–410 - PubMed
    1. Anai T, Yamada T, Hideshima R, Kinoshita T, Rahman SM, Takagi Y. (2008) Two high-oleic-acid soybean mutants, M23 and KK21, have disrupted microsomal omega-6 fatty acid desaturase, encoded by GmFAD2-1a. Breed Sci 58: 447–452

Publication types

LinkOut - more resources