

Intratumor heterogeneity characterized by textural features on baseline 18F-FDG PET images predicts response to concomitant radiochemotherapy in esophageal cancer
- PMID: 21321270
- PMCID: PMC3789272
- DOI: 10.2967/jnumed.110.082404
Intratumor heterogeneity characterized by textural features on baseline 18F-FDG PET images predicts response to concomitant radiochemotherapy in esophageal cancer
Abstract
(18)F-FDG PET is often used in clinical routine for diagnosis, staging, and response to therapy assessment or prediction. The standardized uptake value (SUV) in the primary or regional area is the most common quantitative measurement derived from PET images used for those purposes. The aim of this study was to propose and evaluate new parameters obtained by textural analysis of baseline PET scans for the prediction of therapy response in esophageal cancer.
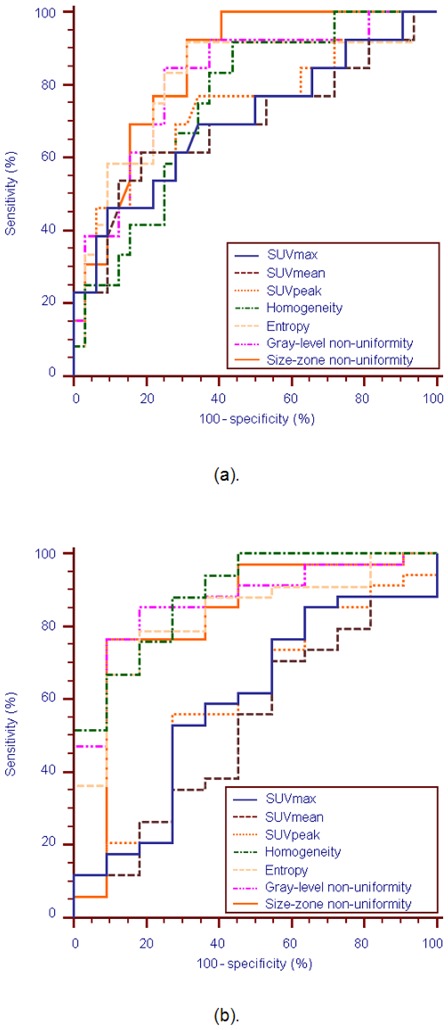
Methods: Forty-one patients with newly diagnosed esophageal cancer treated with combined radiochemotherapy were included in this study. All patients underwent pretreatment whole-body (18)F-FDG PET. Patients were treated with radiotherapy and alkylatinlike agents (5-fluorouracil-cisplatin or 5-fluorouracil-carboplatin). Patients were classified as nonresponders (progressive or stable disease), partial responders, or complete responders according to the Response Evaluation Criteria in Solid Tumors. Different image-derived indices obtained from the pretreatment PET tumor images were considered. These included usual indices such as maximum SUV, peak SUV, and mean SUV and a total of 38 features (such as entropy, size, and magnitude of local and global heterogeneous and homogeneous tumor regions) extracted from the 5 different textures considered. The capacity of each parameter to classify patients with respect to response to therapy was assessed using the Kruskal-Wallis test (P < 0.05). Specificity and sensitivity (including 95% confidence intervals) for each of the studied parameters were derived using receiver-operating-characteristic curves.
Results: Relationships between pairs of voxels, characterizing local tumor metabolic nonuniformities, were able to significantly differentiate all 3 patient groups (P < 0.0006). Regional measures of tumor characteristics, such as size of nonuniform metabolic regions and corresponding intensity nonuniformities within these regions, were also significant factors for prediction of response to therapy (P = 0.0002). Receiver-operating-characteristic curve analysis showed that tumor textural analysis can provide nonresponder, partial-responder, and complete-responder patient identification with higher sensitivity (76%-92%) than any SUV measurement.
Conclusion: Textural features of tumor metabolic distribution extracted from baseline (18)F-FDG PET images allow for the best stratification of esophageal carcinoma patients in the context of therapy-response prediction.
Figures


References
-
- Gebski V, Burmeister B, Smithers BM, et al. Survival benefits from neoadjuvant chemoradiotherapy or chemotherapy in oesophageal carcinoma: a meta-analysis. Lancet Oncol. 2007;8:226–234. - PubMed
-
- Cunningham D, Allum WH, Stenning SP, et al. MAGIC Trial Participants: Perioperative chemotherapy versus surgery alone for resectable gastroesophageal cancer. N Engl J Med. 2006;355:11–20. - PubMed
-
- Di Fabio F, Pinto C, Rojas Llimpe FL, et al. The predictive value of 18F-FDG PET early evaluation in patients with metastatic gastric adenocarcinoma treated with chemotherapy plus cetuximab. Gastric Cancer. 2007;10:221–227. - PubMed
-
- Krause BJ, Herrmann K, Wieder H, zum Büschenfelde CM. 18F-FDG PET and 18F-FDG PET/CT for Assessing Response to Therapy in Esophageal Cancer. J Nucl Med. 2009;50:89S–96S. - PubMed
-
- van Westreenen H, Westerterp M, Bossuyt P, et al. Systematic Review of the Staging Performance of 18F-Fluorodeoxyglucose Positron Emission Tomography in Esophageal Cancer. J Clin Oncol. 2004;22:3805–3812. - PubMed
Publication types
MeSH terms
Substances
LinkOut - more resources
Full Text Sources
Other Literature Sources
Medical