. 2011 Apr 1;10(4):2104-12.
doi: 10.1021/pr1011119. Epub 2011 Mar 7.

Advantages of tandem LC-MS for the rapid assessment of tissue-specific metabolic complexity using a pentafluorophenylpropyl stationary phase

Affiliations

Advantages of tandem LC-MS for the rapid assessment of tissue-specific metabolic complexity using a pentafluorophenylpropyl stationary phase

Haitao Lv et al. J Proteome Res. .

Abstract

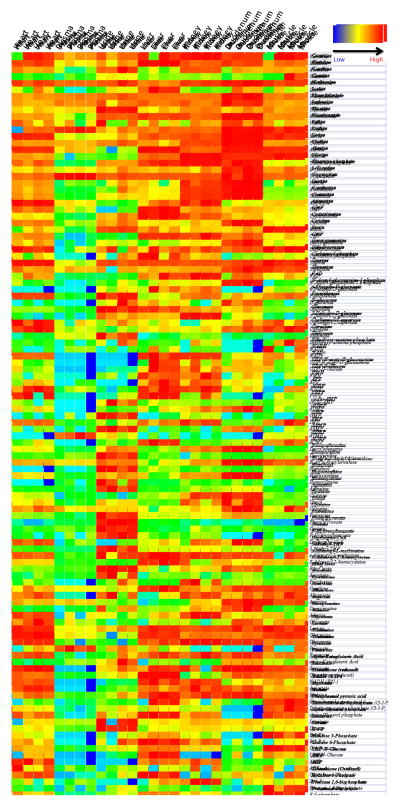
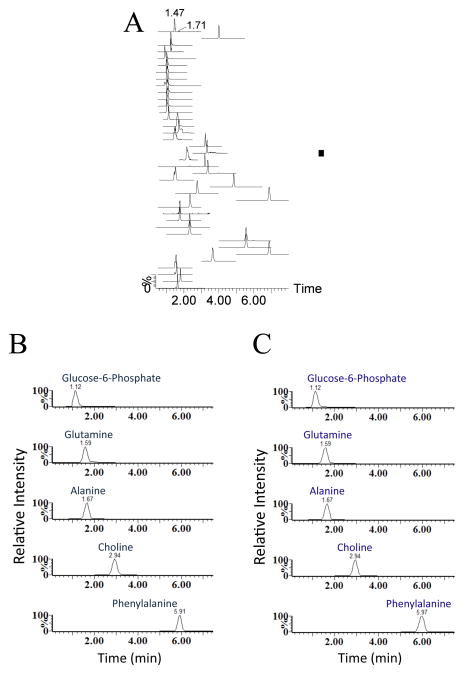
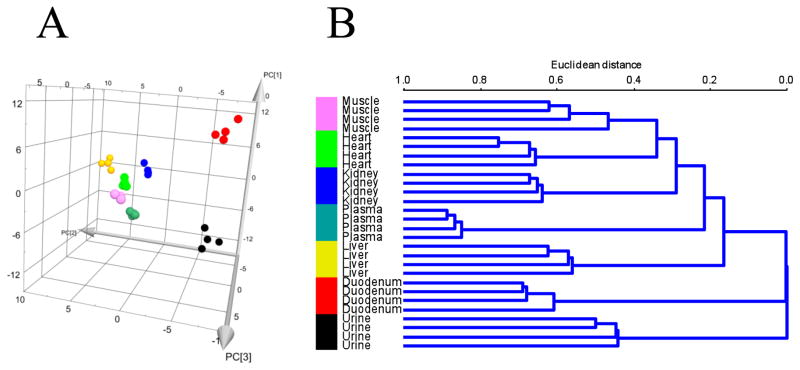
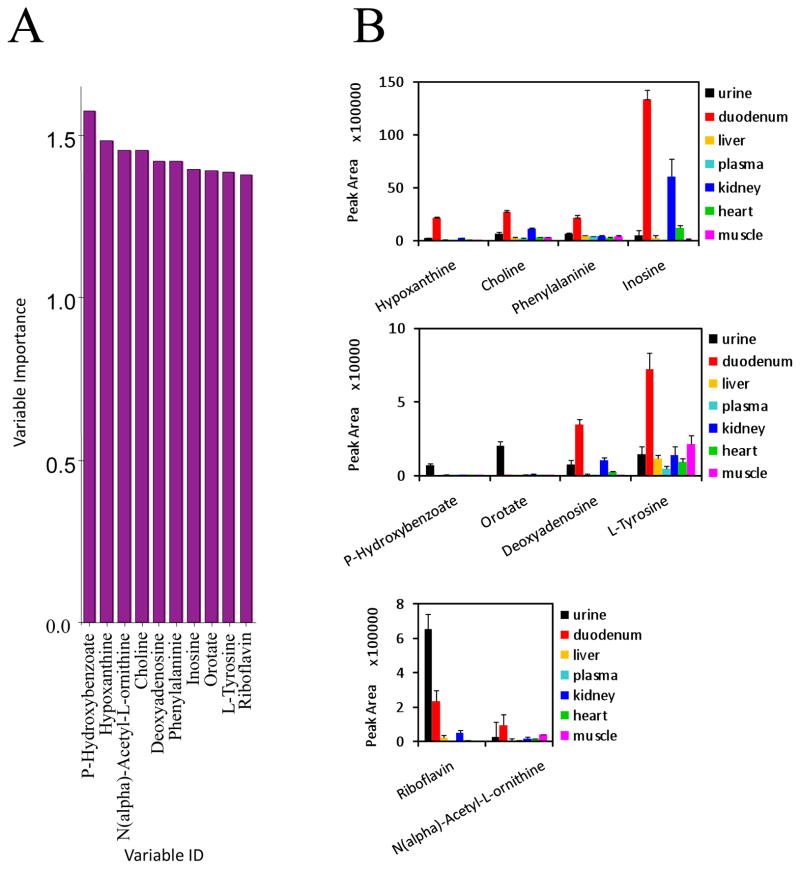
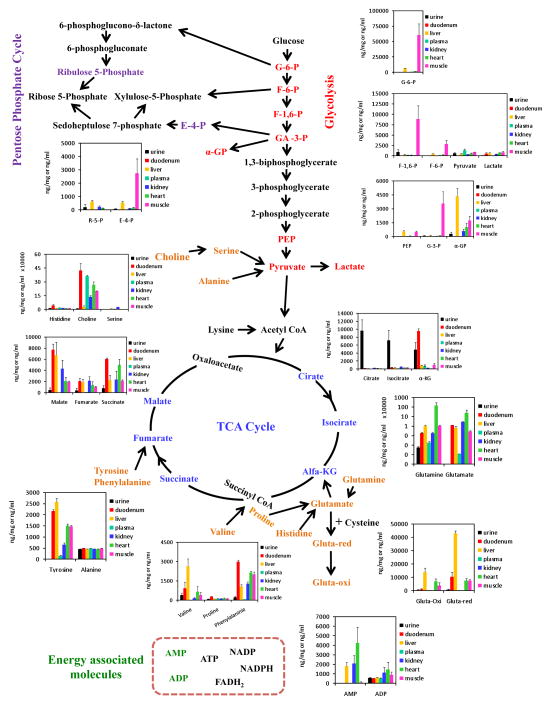
In this study, a tandem LC-MS (Waters Xevo TQ) MRM-based MS method was developed for rapid, broad profiling of hydrophilic metabolites from biological samples, in either positive or negative ion modes without the need for an ion pairing reagent, using a reversed-phase pentafluorophenylpropyl (PFPP) column. The developed method was successfully applied to analyze various biological samples from C57BL/6 mice, including urine, duodenum, liver, plasma, kidney, heart, and skeletal muscle. As result, a total 112 of hydrophilic metabolites were detected within 8 min of running time to obtain a metabolite profile of the biological samples. The analysis of this number of hydrophilic metabolites is significantly faster than previous studies. Classification separation for metabolites from different tissues was globally analyzed by PCA, PLS-DA and HCA biostatistical methods. Overall, most of the hydrophilic metabolites were found to have a "fingerprint" characteristic of tissue dependency. In general, a higher level of most metabolites was found in urine, duodenum, and kidney. Altogether, these results suggest that this method has potential application for targeted metabolomic analyzes of hydrophilic metabolites in a wide ranges of biological samples.


Figures

Figure 1
Figure 1
Heat map illustrating levels of 112 metabolites found in heart, liver, kidney, duodenum, skeletal muscle tissues, as well as plasma and urine from C57BL/6 mice (see Methods).
Figure 2
Figure 2
TIC obtained from the MRM screening mode of hydrophilic metabolites of the standards versus biological samples taken from C57BL/6 mice by UPLC-TQ MS. A. Overview of MRM chromatograms of the standards used: B. representative MRM spectra of metabolite standards glucose 6-phosphate, glutamine, alanine, choline and phenylalanine assessed; C. Corresponding MRM spectra of glucose 6-phosphate, glutamine, alanine, choline and phenylalanine from biological samples.
Figure 3
Figure 3
Multivariate principal component and hierarchical analyses using the normalized peaks areas of 112 hydrophilic metabolites detected in plasma, urine, duodenum, liver, kidney, heart, and skeletal muscle samples from C57BL/6 mice. A. Three-dimensional PCA score plot of the different types of samples. B. Hierarchical clustering plot of the different types of samples.
Figure 4
Figure 4
Levels of the 10 more significant metabolites determined from the variable importance plot of PLS-DA analysis, reflecting the metabolic complexity differentiating different types of biological samples. A. Variable importance plot showing the 10 more significant hydrophilic metabolites contributing to the samples differential clustering pattern. B. Relative levels of the 10 more significant metabolites contributing to the samples distinctive metabolomics patterns.
Figure 5
Figure 5
Metabolic pathway inter-dependence reflected by the quantitative levels of 30 hydrophilic metabolites from glycolysis TCA cycle, pentose phosphate cycle and amino acids. Colored words indicate that the metabolites were determined quantitatively; black words were metabolites analyzed in a relative manner.

References

    1. Daviss B. Growing pains for metabolomics. The Scientist. 2005;19:25–28.
    1. Jordan KW, Nordenstam J, Lauwers GY, Rothenberger DA, Alavi K, Garwood M, Cheng LL. Metabolomic characterization of human rectal adenocarcinoma with intact tissue magnetic resonance spectroscopy. Diseases of the Colon & Rectum. 2009;52:520–525. - PMC - PubMed
    1. Jansson JK, Willing B, Lucio M, Fekete A, Dicksved J, Halfvarson J, Tysk C, Schmitt-Kopplin P. Metabolomics Reveals Metabolic Biomarkers of Crohn’s Disease. PloS one. 2009;4:e6386. - PMC - PubMed
    1. Robertson D, Lindon JC, Nicholson JK, Holmes E, editors. Metabonomics in Toxicity Assessment. CRC Press; Boca Raton: 2005.
    1. Brindle JT, Antti H, Holmes E, Tranter G, Nicholson JK, Bethell HWL, Clarke S, Schofield PM, McKilligin E, Mosedale D, Grainger DJ. Rapid and non-invasive diagnosis of the presence and severity of coronary heart disease using 1H-NMR based metabonomics. Nature Med. 2002;8:1439–1445. - PubMed

Publication types

Substances