

Transgenic overexpression of p23 induces spontaneous hydronephrosis in mice
- PMID: 21323770
- PMCID: PMC3144513
- DOI: 10.1111/j.1365-2613.2011.00762.x
Transgenic overexpression of p23 induces spontaneous hydronephrosis in mice
Abstract
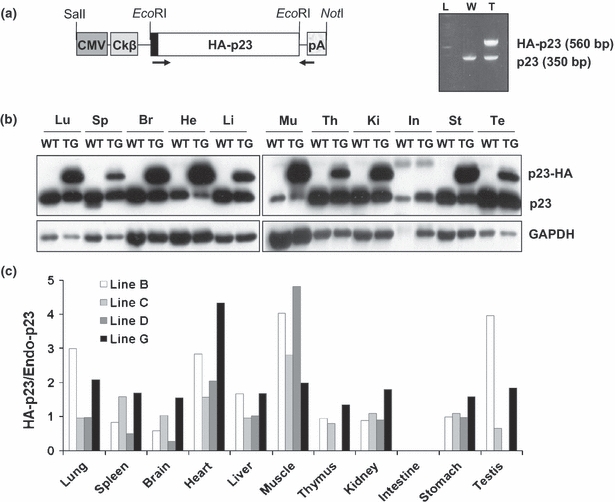
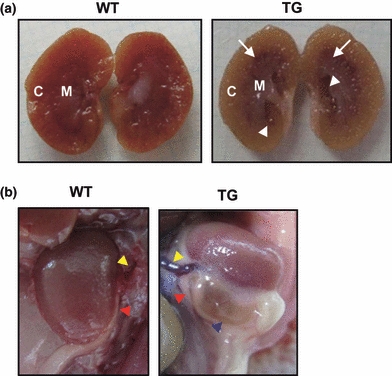
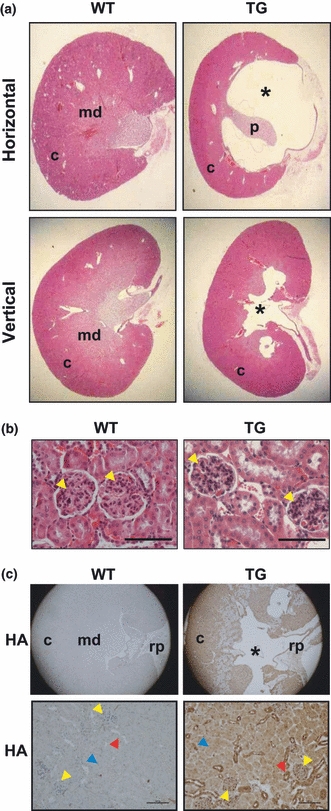
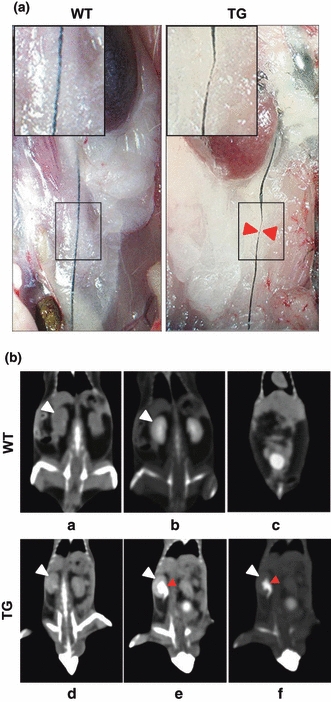
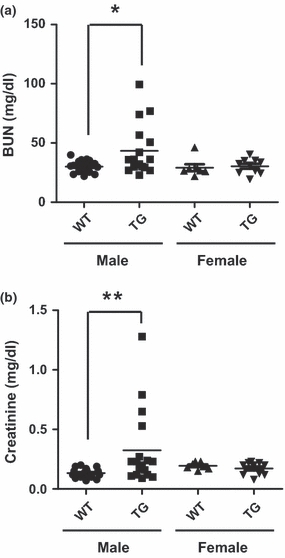
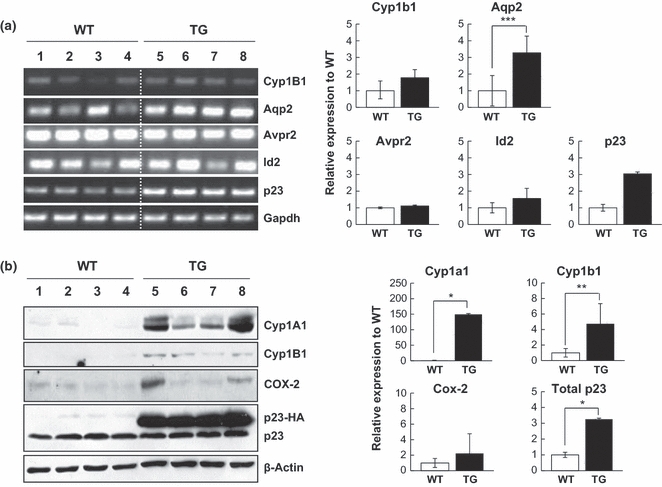
p23 is a cochaperone of heat shock protein 90 and also interacts functionally with numerous steroid receptors and kinases. However, the in vivo roles of p23 remain unclear. To explore its in vivo function, we generated the transgenic (TG) mice ubiquitously overexpressing p23. The p23 TG mice spontaneously developed kidney abnormalities closely resembling human hydronephrosis. Consistently, kidney functions deteriorate significantly in the p23 TG mice compared to their wild-type (WT) littermates. Furthermore, the expression of target genes for aryl hydrocarbon receptor (AhR), such as cytochrome P450, family 1, subfamily A, polypeptide 1 (Cyp1A1) and cytochrome P450, family 1, subfamily B, polypeptide 1 (Cyp1B1), were induced in the kidneys of the p23 TG mice. These results indicate that the overexpression of p23 contributes to the development of hydronephrosis through the upregulation of the AhR pathway in vivo.
© 2011 The Authors. International Journal of Experimental Pathology © 2011 International Journal of Experimental Pathology.
Figures
Similar articles
-
The Aryl-hydrocarbon receptor does not require the p23 co-chaperone for ligand binding and target gene expression in vivo.Toxicol Lett. 2009 Aug 25;189(1):57-62. doi: 10.1016/j.toxlet.2009.05.002. Epub 2009 May 15. Toxicol Lett. 2009. PMID: 19447165 Free PMC article.
-
p23 co-chaperone protects the aryl hydrocarbon receptor from degradation in mouse and human cell lines.Biochem Pharmacol. 2012 Sep 15;84(6):838-50. doi: 10.1016/j.bcp.2012.06.018. Epub 2012 Jul 1. Biochem Pharmacol. 2012. PMID: 22759865 Free PMC article.
-
Knockout of the aryl hydrocarbon receptor results in distinct hepatic and renal phenotypes in rats and mice.Toxicol Appl Pharmacol. 2013 Oct 15;272(2):503-18. doi: 10.1016/j.taap.2013.06.024. Epub 2013 Jul 13. Toxicol Appl Pharmacol. 2013. PMID: 23859880
-
Loss of hepatic aryl hydrocarbon receptor protein in adrenalectomized rats does not involve altered levels of the receptor's cytoplasmic chaperones.Can J Physiol Pharmacol. 2013 Dec;91(12):1154-7. doi: 10.1139/cjpp-2013-0238. Epub 2013 Aug 16. Can J Physiol Pharmacol. 2013. PMID: 24289088 Free PMC article.
-
Cytochrome P450 1 family and cancers.J Steroid Biochem Mol Biol. 2015 Mar;147:24-30. doi: 10.1016/j.jsbmb.2014.11.003. Epub 2014 Nov 6. J Steroid Biochem Mol Biol. 2015. PMID: 25448748 Review.
Cited by
-
Cytosolic Bax: does it require binding proteins to keep its pro-apoptotic activity in check?J Biol Chem. 2012 Mar 16;287(12):9112-27. doi: 10.1074/jbc.M111.248906. Epub 2012 Jan 25. J Biol Chem. 2012. PMID: 22277657 Free PMC article.
-
Implications of Genetic Factors Underlying Mouse Hydronephrosis: Cautionary Considerations on Phenotypic Interpretation in Genetically Engineered Mice.Int J Mol Sci. 2024 Jun 29;25(13):7203. doi: 10.3390/ijms25137203. Int J Mol Sci. 2024. PMID: 39000307 Free PMC article.
-
Chaperoning steroidal physiology: lessons from mouse genetic models of Hsp90 and its cochaperones.Biochim Biophys Acta. 2012 Mar;1823(3):722-9. doi: 10.1016/j.bbamcr.2011.11.006. Epub 2011 Dec 4. Biochim Biophys Acta. 2012. PMID: 22155719 Free PMC article. Review.
-
Investigation and identification of etiologies involved in the development of acquired hydronephrosis in aged laboratory mice with the use of high-frequency ultrasound imaging.Pathobiol Aging Age Relat Dis. 2014 Aug 1;4. doi: 10.3402/pba.v4.24932. eCollection 2014. Pathobiol Aging Age Relat Dis. 2014. PMID: 25143818 Free PMC article.
-
MicroRNA-1912 regulates cholesterol homeostasis by targeting PCSK9.Mol Ther Nucleic Acids. 2025 Jun 9;36(3):102589. doi: 10.1016/j.omtn.2025.102589. eCollection 2025 Sep 9. Mol Ther Nucleic Acids. 2025. PMID: 40673160 Free PMC article.
References
-
- Abbott BD, Birnbaum LS, Pratt RM. TCDD-induced hyperplasia of the ureteral epithelium produces hydronephrosis in murine fetuses. Teratology. 1987;35:329–334. - PubMed
-
- Akalin A, Elmore LW, Forsythe HL, et al. Holt a novel mechanism for chaperone-mediated telomerase regulation during prostate cancer progression. Cancer Res. 2001;61:4791–4796. - PubMed
-
- Aoki Y, Mori S, Kitajima K, et al. Id2 haploinsufficiency in mice leads to congenital hydronephrosis resembling that in humans. Genes Cells. 2004;9:1287–1296. - PubMed
-
- Beischlag TV, Perdew GH. ER alpha-AHR-ARNT protein-protein interactions mediate estradiol-dependent transrepression of dioxin-inducible gene transcription. J. Biol. Chem. 2005;280:21607–21611. - PubMed
-
- Belarmino JM, Kogan BA. Management of neonatal hydronephrosis. Early Hum. Dev. 2006;82:9–14. - PubMed
Publication types
MeSH terms
Substances
LinkOut - more resources
Full Text Sources
Molecular Biology Databases
Miscellaneous
