. 2011;12(2):R16.
doi: 10.1186/gb-2011-12-2-r16. Epub 2011 Feb 16.

Genomewide characterization of non-polyadenylated RNAs

Affiliations

Genomewide characterization of non-polyadenylated RNAs

Li Yang et al. Genome Biol. 2011.

Abstract

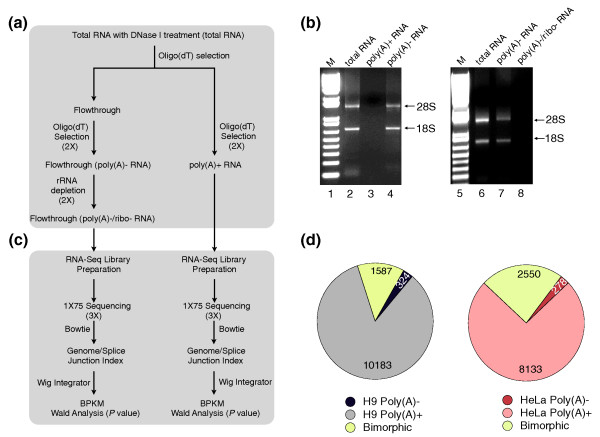
Background: RNAs can be physically classified into poly(A)+ or poly(A)- transcripts according to the presence or absence of a poly(A) tail at their 3' ends. Current deep sequencing approaches largely depend on the enrichment of transcripts with a poly(A) tail, and therefore offer little insight into the nature and expression of transcripts that lack poly(A) tails.

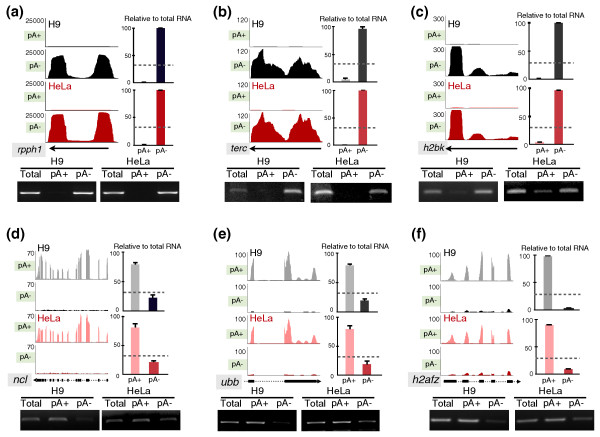
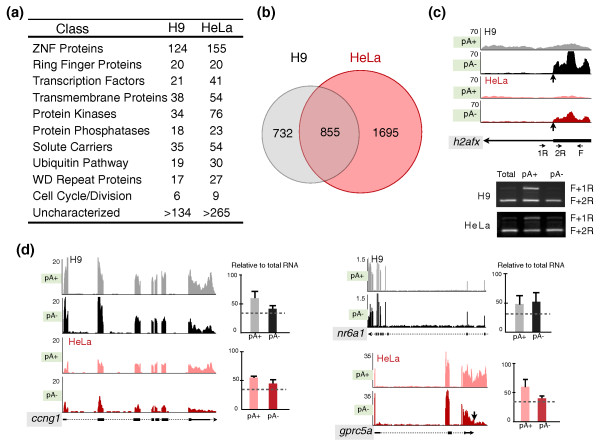
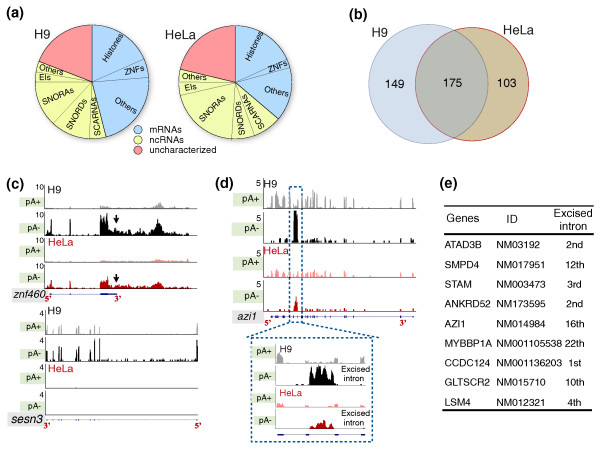
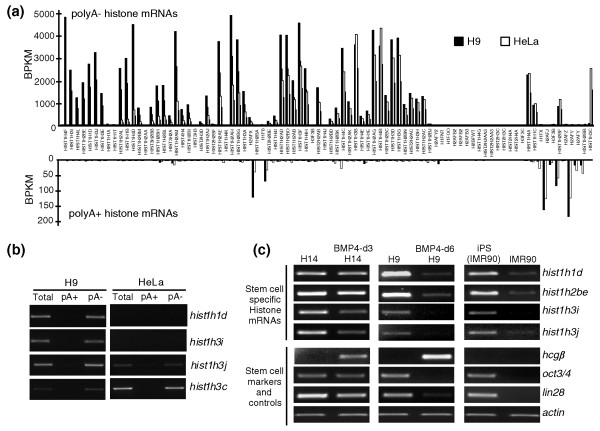
Results: We have used deep sequencing to explore the repertoire of both poly(A)+ and poly(A)- RNAs from HeLa cells and H9 human embryonic stem cells (hESCs). Using stringent criteria, we found that while the majority of transcripts are poly(A)+, a significant portion of transcripts are either poly(A)- or bimorphic, being found in both the poly(A)+ and poly(A)- populations. Further analyses revealed that many mRNAs may not contain classical long poly(A) tails and such messages are overrepresented in specific functional categories. In addition, we surprisingly found that a few excised introns accumulate in cells and thus constitute a new class of non-polyadenylated long non-coding RNAs. Finally, we have identified a specific subset of poly(A)- histone mRNAs, including two histone H1 variants, that are expressed in undifferentiated hESCs and are rapidly diminished upon differentiation; further, these same histone genes are induced upon reprogramming of fibroblasts to induced pluripotent stem cells.

Conclusions: We offer a rich source of data that allows a deeper exploration of the poly(A)- landscape of the eukaryotic transcriptome. The approach we present here also applies to the analysis of the poly(A)- transcriptomes of other organisms.


Figures

Figure 1
Figure 1
Poly(A)+, poly(A)- and bimorphic transcripts revealed by deep sequencing. (a) A diagram of the experimental approach. Total RNAs were extracted from H9 cells or HeLa cells and treated with DNaseI before being subjected to poly(A)+ and poly(A)- transcript enrichment. See text for details. The enriched poly(A)- and poly(A)+ RNAs were used to prepare single-end RNA-Seq libraries. The size-selected single-end libraries were sequenced using 76 cycles. The single-end reads were trimmed from the 3' end to a total length of 75 nucleotides prior to alignment. (b) Agarose gel electrophoresis to confirm the poly(A)- RNA purification. The gel on the left shows that the poly(A)+ RNA fraction from HeLa cells contains no detectable rRNA but that the poly(A)- material not bound to oligo(dT) beads contained most of the rRNA. The gel on the right shows that subsequent rRNA depletion removes the great majority of rRNA from the poly(A)- sample. M, the molecular weight marker. (c) A diagram of the analytical approach. Sequence analysis involved aligning all reads to a combined database of the genome and splice junctions using Bowtie [15,19]. The read counts were then further analyzed using the normalized value BPKM (bases per kilobase of gene model per million mapped bases) to identify poly(A)- and bimorphic transcripts that were significantly different between the poly(A)+ and poly(A)- samples. (d) Classification of poly(A)+, poly(A)- and bimorphic predominant transcripts. Poly(A)+, poly(A)- and bimorphic predominant transcripts were classified according to their relative abundance between the poly(A)+ and poly(A)- samples in individual cell lines. See text and Materials and methods for details.
Figure 2
Figure 2
Validation of selected poly(A)+ and poly(A)- transcripts. (a-c) Validation of known poly(A)- transcripts. Y-axis: normalized read densities of each gene from the UCSC genome browser (left panels). Quantitative RT-PCR (qRT-PCR) was performed with independent poly(A)+ and poly(A)- sample preparations, and the relative signals from each enriched RNA preparation were normalized to those in the total RNA preparations from different cell lines (right panels). Note that the signals for poly(A)- transcripts were significantly enriched in the poly(A)- samples. (d-e) Validation of known poly(A)+ transcripts. Normalized read densities (left panels) and qRT-PCRs (right panels) were analyzed as described above. Note that the signals for poly(A)+ transcripts were significantly enriched in the poly(A)+ samples. Grey, poly(A)+ sample from H9 cells; black, poly(A)- sample from H9 cells; pink, poly(A)+ sample from HeLa cells; red, poly(A)- sample from HeLa cells. Dashed lines, the cutoff ratio used to assign poly(A)+ and poly(A)- transcripts (the abundance in either poly(A)+ or poly(A)- fractionation accounts for more than one-third when compared to the total RNA). Gene models are shown beneath the UCSC genome browser screenshots. See text for details. These descriptions are also used for other figures throughout this study. Error bars were calculated from three biological repeats.
Figure 3
Figure 3
Classification of bimorphic transcripts. (a) Gene ontology analysis of bimorphic transcripts according to their functions; see text for details. (b) Overlapping analysis of the expression of bimorphic transcripts in H9 and HeLa cells. (c) An example of a bimorphic histone mRNA, hist1h2afx. Normalized read densities of hist1h2afx from the UCSC genome browser (upper panels). Note that the two isoforms were distinct in poly(A)+ and poly(A)- samples from H9 and HeLa cells. Bottom panels, semi-quantitative RT-PCR with primers that recognize either the longer poly(A)+ transcript or both transcripts confirmed the observations from the deep sequencing. F, forward primer; 1R and 2R, reverse primers. The vertical arrow depicts the position of U7-mediated 3' end formation. (d) Validation of identified bimorphic transcripts, ccng1(left panels), nr6a1 (right upper panels) and gprc5a (right bottom panels). Normalized read densities and qRT-PCRs were analyzed as described above. Note that the signals for these transcripts were similar in both poly(A)+ and poly(A)-samples. See text for details. Error bars were calculated from three biological repeats.
Figure 4
Figure 4
Visualization of incomplete transcripts in the poly(A)- samples. (a) A bimorphic example showing uniform coverage across the complete transcript. Note that the majority of the identified bimorphic transcripts are similar to this. (b) Examples of bimorphic transcripts with non-uniform coverage. Note that both ubr 4 (retinoblastoma-associated factor 600) and nup155 (nucleoporin 155 kDa) show similar normalized read densities in poly(A)+ and poly(A)- samples; however, both exhibit a gradual enrichment toward the 5' ends of the genes (blue dashed lines) in the poly(A)- samples. (c) Examples of non-poly(A)+ transcripts with non-uniform coverage. Note that both sf3b2 (splicing factor 3b, subunit 2) and eif3a (eukaryotic translation initiation factor 3) exhibit a gradual 5' end enrichment (blue dashed lines) in the poly(A)- samples, although both are more abundant in poly(A)+ samples (note the difference in the y-axis). (d) Examples of bimorphic and poly(A)+ transcripts with non-uniform coverage. See text for details.
Figure 5
Figure 5
Classification of poly(A)- transcripts. (a) Classification of poly(A)- transcripts: EIs, excised introns; ZNF, zinc finger factor protein family. See text for details. (b) Overlapping analysis of the expression of poly(A)- transcripts in H9 and HeLa cells. (c) Example of a poly(A)- non-histone mRNA, znf460 and sesn3. The relative signals from either poly(A)+ or poly(A)- RNA preparations were normalized to those in the total RNA preparation in each cell line. Note that the signals from the poly(A)- samples are significantly enriched. Black arrows show the extended unannotated 3' UTR region of znf460. (d) An example of the excised 16th intron of the mRNA azi1. The blue box reveals the information in detail from this region. Note that the excised intron is abundant and can be detected only in the poly(A)- samples. (e) Examples of excised introns from different mRNAs, and the position of the excised intron in each mRNA is indicated.
Figure 6
Figure 6
Some histone genes are specifically expressed in hESCs and are preferentially associated with pluripotency. (a) The relative expression (normalized read densities) of all histone genes in both H9 and HeLa cells. Note that a number of histone genes showed significantly higher expression in H9 cells compared to that in HeLa cells, while a few showed a HeLa cell-specific expression pattern. (b) Validation of cell-specific histone mRNA expression by semi-quantitative RT-PCR using RNAs prepared according to their 3' end status. (c) Pluripotency-associated histone gene expression. Total RNAs were collected from different cell lines or cells treated under differentiation or reprogramming conditions, and were then treated with DNaseI before being subjected to semi-quantitative RT-PCR analysis. Some histone mRNAs (hist1h1d, hist1h2b, hist1h3i, and hist1h3j) were found to be preferentially expressed in undifferentiated stem cells and in reprogrammed cells, but their expression rapidly decreased upon differentiation and was low prior to reprogramming. hcgβ is a marker for trophoblast differentiation; oct3/4 and lin28 are pluripotency markers; and actin was used as a loading control.

References

    1. Moore MJ, Proudfoot NJ. Pre-mRNA processing reaches back to transcription and ahead to translation. Cell. 2009;136:688–700. doi: 10.1016/j.cell.2009.02.001. - DOI - PubMed
    1. Manley JL, Proudfoot NJ, Platt T. RNA 3'-end formation. Genes Dev. 1989;3:2218–2244. doi: 10.1101/gad.3.12b.2218. - DOI - PubMed
    1. Pan Q, Shai O, Lee LJ, Frey BJ, Blencowe BJ. Deep surveying of alternative splicing complexity in the human transcriptome by high-throughput sequencing. Nat Genet. 2008;40:1413–1415. doi: 10.1038/ng.259. - DOI - PubMed
    1. Wang ET, Sandberg R, Luo S, Khrebtukova I, Zhang L, Mayr C, Kingsmore SF, Schroth GP, Burge CB. Alternative isoform regulation in human tissue transcriptomes. Nature. 2008;456:470–476. doi: 10.1038/nature07509. - DOI - PMC - PubMed
    1. Li JB, Levanon EY, Yoon JK, Aach J, Xie B, Leproust E, Zhang K, Gao Y, Church GM. Genome-wide identification of human RNA editing sites by parallel DNA capturing and sequencing. Science. 2009;324:1210–1213. doi: 10.1126/science.1170995. - DOI - PubMed

Publication types