. 2011;15(1):R63.
doi: 10.1186/cc10037. Epub 2011 Feb 16.

Circulating soluble urokinase plasminogen activator receptor is stably elevated during the first week of treatment in the intensive care unit and predicts mortality in critically ill patients

Affiliations

Circulating soluble urokinase plasminogen activator receptor is stably elevated during the first week of treatment in the intensive care unit and predicts mortality in critically ill patients

Alexander Koch et al. Crit Care. 2011.

Abstract

Introduction: suPAR is the soluble form of the urokinase plasminogen activator receptor (uPAR), which is expressed in various immunologically active cells. High suPAR serum concentrations are suggested to reflect the activation of the immune system in circumstances of inflammation and infection, and have been associated with increased mortality in different populations of non-intensive care patients. In this study we sequentially analyzed suPAR serum concentrations within the first week of intensive care in a large cohort of well characterized intensive care unit (ICU) patients, in order to investigate potential regulatory mechanisms and evaluate the prognostic significance in critically ill patients.

Methods: A total of 273 patients (197 with sepsis, 76 without sepsis) were studied prospectively upon admission to the medical intensive care unit (ICU), on Day 3 and Day 7, and compared to 43 healthy controls. Clinical data, various laboratory parameters as well as investigational inflammatory cytokine profiles were assessed. Patients were followed for approximately one year.

Results: Upon admission to the ICU suPAR serum concentrations were elevated in critically ill patients as compared with healthy controls. In sepsis patients suPAR levels were higher than in non-sepsis patients (with or without systemic inflammatory response syndrome (SIRS)). During the first week after admission to the ICU serum suPAR concentrations remained stably elevated. suPAR serum concentrations measured upon admission were closely and independently correlated to various laboratory parameters, specifically biomarkers of inflammation (tumor necrosis factor (TNF), C-reactive protein (CRP)), hepatic and renal dysfunction. High suPAR levels at admission and at Day 3 were a strong independent predictor for both ICU and long-term mortality in critically ill patients.

Conclusions: In sepsis and non-sepsis patients suPAR serum concentrations are increased upon admission to the ICU, likely reflecting the activation state of the immune system, and remain stably elevated in the initial course of treatment. Low suPAR levels are a positive predictor of ICU- and overall survival in critically ill patients, including sepsis and non-sepsis patients. Aside from its value as a promising new prognostic biomarker, both experimental and clinical studies are required in order to understand the specific effects and regulatory mechanisms of suPAR in SIRS and sepsis, and may reveal new therapeutic options.


Figures

Figure 1
Figure 1
Serum suPAR concentrations in critically ill patients with different disease etiologies at ICU admission. (A) At admission to the Medical ICU, serum suPAR levels were significantly (P < 0.001, U-test) elevated in critically ill patients (n = 273) as compared to healthy controls (n = 43). (B) In comparison to ICU patients without SIRS or with SIRS, septic patients had higher suPAR serum concentrations (U-tests to sepsis group, P-values given in figure). (C) suPAR serum concentrations did not differ in patients with either pulmonary or non-pulmonary origin of sepsis and are highest in patients with decompensated liver cirrhosis.
Figure 2
Figure 2
Serum suPAR concentrations and predictive power for sepsis at ICU admission. (A) In patients with sepsis suPAR serum concentrations were significantly (P < 0.001, U-test) higher as compared with patients with non-septic etiology of critical illness. (B) Receiver operating characteristic (ROC) curve analyses comparing the diagnostic power in predicting sepsis of suPAR (black line, area under the curve = AUC 0.615) with classical markers of inflammation and bacterial infection, C-reactive protein (CRP; grey line, AUC 0.857), procalcitonin (PCT; dotted black line, AUC 0.780) and white blood cell count (leukocytes; dotted grey line, AUC 0.564).
Figure 3
Figure 3
Sequential measurements of suPAR serum concentrations during the first week of intensive care treatment. (A) Serum suPAR levels were assessed at admission (Day 1), at Day 3 and Day 7 in all critically ill patients. Overall, serum suPAR concentrations did not significantly change during the course of disease within the first week after admission to the ICU (Wilcoxon-Test). (B) In subgroup analyses for sepsis and non-sepsis patients as well, no significant changes of suPAR serum levels within the first week of ICU treatment could be detected.
Figure 4
Figure 4
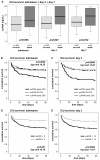
Prediction of ICU mortality by sequential suPAR serum concentrations. (A) Patients that die during the course of ICU treatment had significantly higher serum suPAR levels on admittance to ICU (P = 0.005), on Day 3 (P = 0.001) and Day 7 (P = 0.014) than survivors. (B and C) Kaplan-Meier survival curves of ICU patients are displayed, showing that patients with suPAR levels of upper quartile (on admission >15 ng/mL, on Day 3 > 15 ng/mL; black) had an increased short-term mortality at the ICU as compared to patients with suPAR serum concentrations of lower quartile (on admission < 6 ng/ml, on Day 3 < 7 ng/ml; grey) or middle 50% (dotted line). P-values are given in the figure. (D and E) Kaplan-Meier survival curves of ICU patients are displayed, showing that patients with high suPAR levels (on admission > 8 ng/mL, on Day 3 > 13 ng/mL; grey) had an increased short-term mortality at the ICU as compared to patients with low suPAR serum concentrations. P-values are given in the figure.
Figure 5
Figure 5
Prediction of long-term mortality by sequential suPAR serum concentrations. (A) Serum suPAR concentrations were significantly associated with the overall survival of critically ill patients. Survivors had significantly lower serum suPAR levels on admittance to ICU (P = 0.005) and on Day 3 (P = 0.009). (B and C) Kaplan-Meier survival curves of ICU patients are displayed, showing that patients with suPAR levels of upper quartile (on admission > 15 ng/mL, on Day 3 > 15 ng/mL; black) had an increased short-term mortality at the ICU as compared to patients with suPAR serum concentrations of lower quartile (on admission < 6 ng/ml, on Day 3 < 7 ng/ml; grey) or middle 50% (dotted line). P-values are given in the figure. (D and E) Kaplan-Meier survival curves of ICU patients are displayed, showing that patients with high suPAR levels (on admission > 8 ng/mL, on Day 3 >13 ng/mL; grey) had an increased overall mortality in the long-term follow-up as compared to patients with low suPAR serum concentrations. P-values are given in the figure.
Figure 6
Figure 6
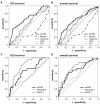
Prognostic value of suPAR for mortality in comparison with other biomarkers and clinical scores in critical illness. (A and B) ROC curve analyses comparing the prognostic value of suPAR at admission for ICU survival/overall survival (black line, AUC 0.684/0.642) with albumin (dashed black line, AUC 0.294/0.329) and creatinine (dotted black line, AUC 0.542/0.576) as makers of hepatic and renal function as well as CRP (grey dotted line, AUC 0.524/0.531) and PCT (grey line, AUC 0.545/0.550) as markers of inflammation and infection. (C and D) ROC curve analyses comparing the predictive power of suPAR at admission for ICU survival/overall survival (black line, AUC 0.668/0.686) with established clinical ICU scores as APACHE II (grey line, AUC 0.541/0.598) and SAPS 2 (dotted black line, AUC 0.807/0.736).

References

    1. Blasi F, Carmeliet P. uPAR: a versatile signalling orchestrator. Nat Rev Mol Cell Biol. 2002;3:932–943. doi: 10.1038/nrm977. - DOI - PubMed
    1. Madsen CD, Ferraris GM, Andolfo A, Cunningham O, Sidenius N. uPAR-induced cell adhesion and migration: vitronectin provides the key. J Cell Biol. 2007;177:927–939. doi: 10.1083/jcb.200612058. - DOI - PMC - PubMed
    1. Madsen CD, Sidenius N. The interaction between urokinase receptor and vitronectin in cell adhesion and signalling. Eur J Cell Biol. 2008;87:617–629. doi: 10.1016/j.ejcb.2008.02.003. - DOI - PubMed
    1. Dano K, Romer J, Nielsen BS, Bjorn S, Pyke C, Rygaard J, Lund LR. Cancer invasion and tissue remodeling--cooperation of protease systems and cell types. APMIS. 1999;107:120–127. doi: 10.1111/j.1699-0463.1999.tb01534.x. - DOI - PubMed
    1. Thuno M, Macho B, Eugen-Olsen J. suPAR: the molecular crystal ball. Dis Markers. 2009;27:157–172. - PMC - PubMed

Publication types

MeSH terms

Substances