. 2011 May;21(5):768-74.
doi: 10.1101/gr.115972.110. Epub 2011 Feb 8.

Maximum-likelihood estimation of recent shared ancestry (ERSA)

Affiliations

Maximum-likelihood estimation of recent shared ancestry (ERSA)

Chad D Huff et al. Genome Res. 2011 May.

Abstract

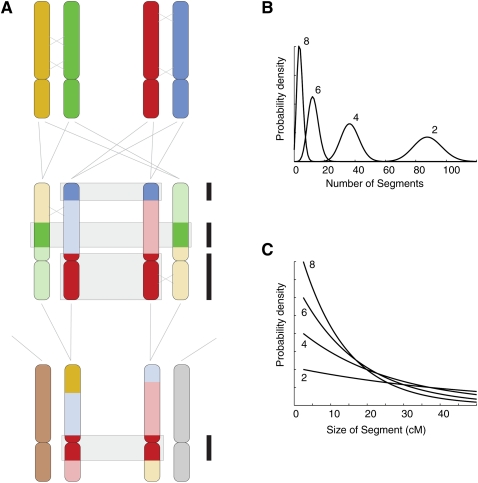
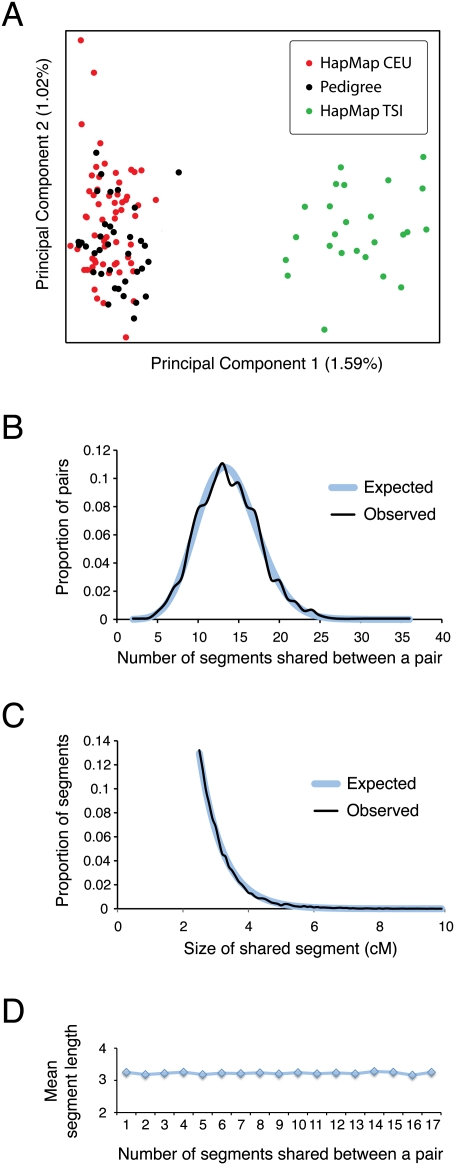
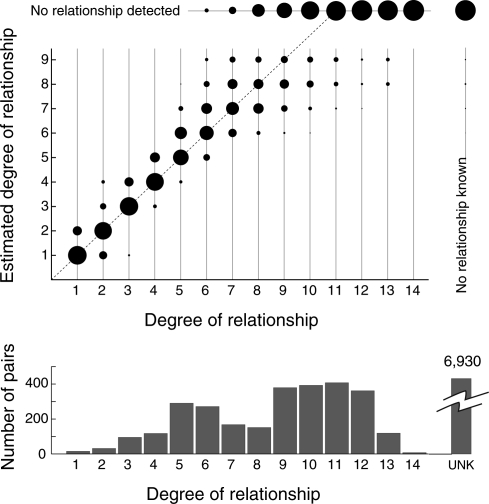
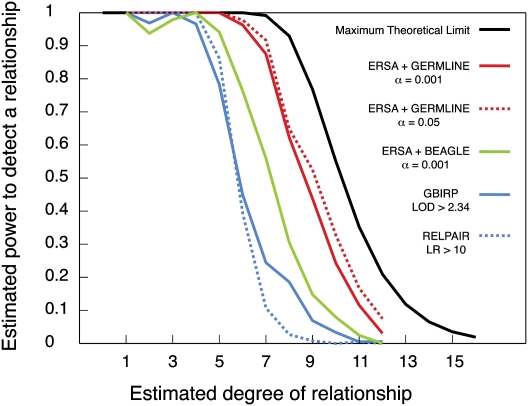
Accurate estimation of recent shared ancestry is important for genetics, evolution, medicine, conservation biology, and forensics. Established methods estimate kinship accurately for first-degree through third-degree relatives. We demonstrate that chromosomal segments shared by two individuals due to identity by descent (IBD) provide much additional information about shared ancestry. We developed a maximum-likelihood method for the estimation of recent shared ancestry (ERSA) from the number and lengths of IBD segments derived from high-density SNP or whole-genome sequence data. We used ERSA to estimate relationships from SNP genotypes in 169 individuals from three large, well-defined human pedigrees. ERSA is accurate to within one degree of relationship for 97% of first-degree through fifth-degree relatives and 80% of sixth-degree and seventh-degree relatives. We demonstrate that ERSA's statistical power approaches the maximum theoretical limit imposed by the fact that distant relatives frequently share no DNA through a common ancestor. ERSA greatly expands the range of relationships that can be estimated from genetic data and is implemented in a freely available software package.


Figures

Figure 1.
Figure 1.
Expected distributions of IBD chromosomal segments between pairs of individuals. (A) The process underlying the pattern of IBD segments. Two homologous autosomal chromosomes are shown for two parents, each colored differently. Meiosis and recombination occur, and two sibling offspring inherit recombinant chromosomes (just one crossover per homologous pair for each meiosis event is depicted, marked by an X). For some segments of the chromosome in question, the siblings share a stretch that was inherited from one of the four parental chromosomes. The three IBD segments are identifiable as regions that share the same color (boxed and marked at right by black bars). The siblings mate with unrelated individuals, and the offspring each inherit an unrelated chromosome (tan or gray) and one that is a recombinant patchwork of the grandparental chromosomes. These first cousins share one segment IBD at this chromosome (red, boxed). (B) The number of segments that a pair of individuals shares IBD, across all chromosomes, is approximately Poisson-distributed with a mean that depends on the number of meioses d on the path relating the individuals (d = 2, 4, 6, 8, corresponding to siblings through third cousins). (C) The lengths of the IBD segments are approximately exponentially distributed, with mean length depending on the relationship between individuals (theoretical distributions shown for d = 2, 4, 6, 8).
Figure 2.
Figure 2.
Characteristics of HapMap CEU parents as a background reference population. (A) Principal Components Analysis comparing 36 individuals from our three pedigrees (no pair closer than seventh-degree relatives) to 85 unrelated individuals from three European populations (60 HapMap CEU parents from 30 parent–offspring trios and 25 HapMap TSI individuals) based on pairwise allele-sharing distances computed from ∼247,000 SNPs typed on the Affymetrix SNP array (for additional details on data and methods, see Xing et al. 2010). The percentage of genetic variation explained by each component is given on the corresponding axis. (B) Distribution of the number of segments with length >2.5 cM that are inferred to be shared IBD by Germline in pairs of CEU individuals (Observed), with fitted Poisson distribution (Expected). (C) Distribution of the lengths of IBD segments longer than 2.5 cM in CEU pairs (Observed), with fitted exponential distribution (Expected). (D) Scatterplot of the number of IBD segments per pair versus the mean length of segments in the pair.
Figure 3.
Figure 3.
Estimated degree of relationship between pairs of individuals versus known degree of relationship. Pedigree information was used to identify 2802 pairs of genotyped individuals that share exactly two common ancestors (a mated pair) and classify them according to the degree of their relationship (horizontal axis). The number of pairs in each category is indicated by the histogram below. Within each category, the areas of the filled circles indicate the proportion of those pairs with various estimated degrees of relationship between a pair (vertical axis; two ancestors, two degrees of freedom, α = 0.001). The total area within a category is a constant across categories. Pairs with a known but undetected relationship are represented across the top. Pairs with no known relationship are represented on the right.
Figure 4.
Figure 4.
Power to detect recent common ancestry between pairs of individuals known to be related at varying degrees. Each pair of individuals has exactly two known ancestors in the pedigree, and both inheritance paths connecting the pair (one through each ancestor) have the same number of meioses in them. (Black) Maximum theoretical power (the probability that a pair of individuals with the given relationship is genetically related at all, calculated from Eq. 7 with a = 2 and t = 0). The power of ERSA using IBD segments estimated by Germline, with α = 0.05 (red dotted line) and α = 0.001 (red solid line) (two degrees of freedom, d.f.). (Green line) Using IBD segments estimated by fastIBD of the Beagle 3.3 package, ERSA achieves the power shown (α = 0.001, 2 d.f.). (Blue dotted line) The power of RELPAIR (Epstein et al. 2000) to detect a relationship (using 9990 evenly spaced autosomal markers with minor allele frequency MAF > 0.4, default likelihood ratio LR threshold of 10 for reporting a relationship as significant). (Blue solid line) The power of GBIRP (Stankovich et al. 2005) (10,028 evenly spaced autosomal markers with MAF > 0.4, LOD threshold of 2.34 for significance as in Stankovich et al. 2005, corresponding to α = 0.001 with 1 d.f.).

References

    1. Alonso A, Martin P, Albarran C, Garcia P, Fernandez de Simon L, Jesus Iturralde M, Fernandez-Rodriguez A, Atienza I, Capilla J, Garcia-Hirschfeld J, et al. 2005. Challenges of DNA profiling in mass disaster investigations. Croat Med J 46: 540–548 - PubMed
    1. Berkovic SF, Dibbens LM, Oshlack A, Silver JD, Katerelos M, Vears DF, Lullmann-Rauch R, Blanz J, Zhang KW, Stankovich J, et al. 2008. Array-based gene discovery with three unrelated subjects shows SCARB2/LIMP-2 deficiency causes myoclonus epilepsy and glomerulosclerosis. Am J Hum Genet 82: 673–684 - PMC - PubMed
    1. Bieber FR, Brenner CH, Lazer D 2006. Finding criminals through DNA of their relatives. Science 312: 1315–1316 - PubMed
    1. Biesecker LG, Bailey-Wilson JE, Ballantyne J, Baum H, Bieber FR, Brenner C, Budowle B, Butler JM, Carmody G, Conneally PM, et al. 2005. Epidemiology. DNA identifications after the 9/11 World Trade Center attack. Science 310: 1122–1123 - PubMed
    1. Boehnke M, Cox NJ 1997. Accurate inference of relationships in sib-pair linkage studies. Am J Hum Genet 61: 423–429 - PMC - PubMed

Publication types

LinkOut - more resources