

Crystal structure and biochemical features of EfeB/YcdB from Escherichia coli O157: ASP235 plays divergent roles in different enzyme-catalyzed processes
- PMID: 21324904
- PMCID: PMC3083225
- DOI: 10.1074/jbc.M110.197780
Crystal structure and biochemical features of EfeB/YcdB from Escherichia coli O157: ASP235 plays divergent roles in different enzyme-catalyzed processes
Abstract
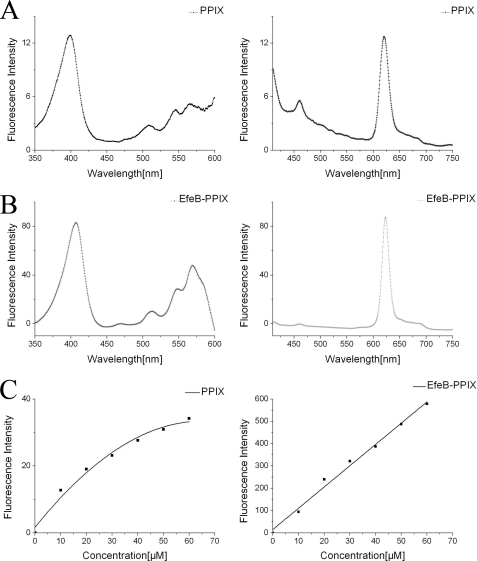
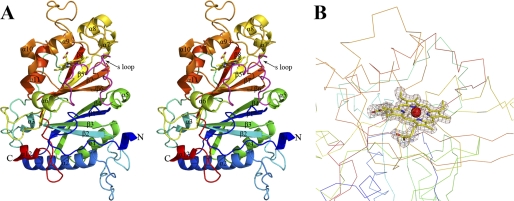
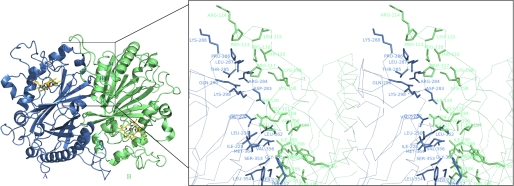
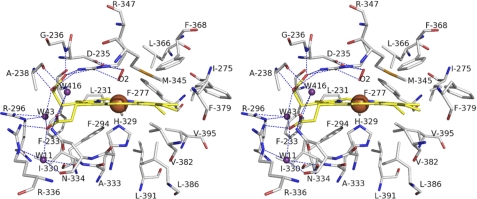
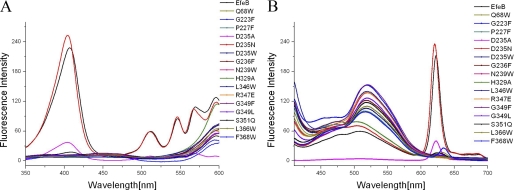
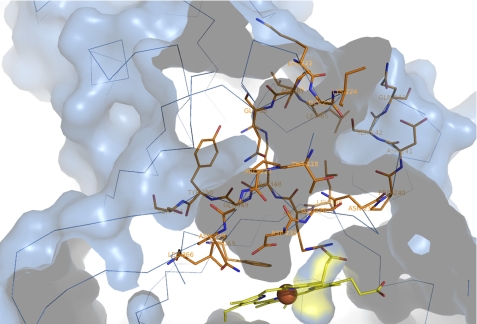
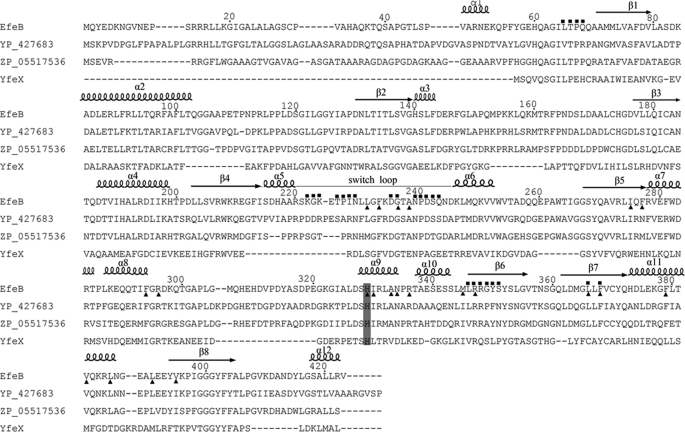
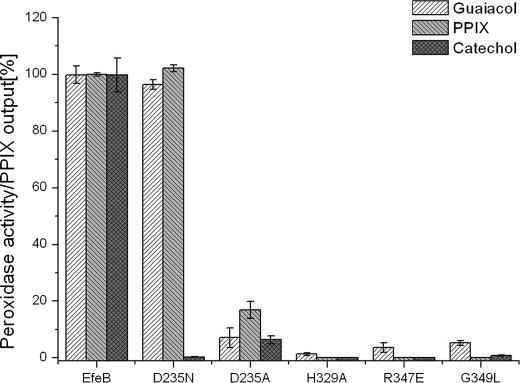
EfeB/YcdB is a member of the dye-decolorizing peroxidase (DyP) protein family. A recent study has shown that this protein can extract iron from heme without breaking the tetrapyrrole ring. We report the crystal structure of EfeB from Escherichia coli O157 bound to heme at 1.95 Å resolution. The EfeB monomer contains two domains. The heme molecule is located in a large hydrophobic pocket in the C-terminal domain. A long loop connecting the two domains extensively interacts with the heme, which is a distinctive structural feature of EfeB homologues. A large tunnel formed by this loop and the β-sheet of C-terminal domain provides a potential cofactor/substrate binding site. Biochemical data show that the production of protoporphyrin IX (PPIX) is closely related to the peroxidation activity. The mutant D235N keeps nearly the same activity of guaiacol peroxidase as the wild-type protein, whereas the corresponding mutation in the classic DyP protein family completely abolished the peroxidation activity. These results suggest that EfeB is a unique member of the DyP protein family. In addition, dramatically enhanced fluorescence excitation and emission of EfeB-PPIX was observed, implying this protein may be used as a red color fluorescence marker.
Figures
Similar articles
-
Crystal structures of EfeB and EfeO in a bacterial siderophore-independent iron transport system.Biochem Biophys Res Commun. 2022 Feb 26;594:124-130. doi: 10.1016/j.bbrc.2022.01.055. Epub 2022 Jan 17. Biochem Biophys Res Commun. 2022. PMID: 35081501
-
Crystal structure and biochemical features of dye-decolorizing peroxidase YfeX from Escherichia coli O157 Asp143 and Arg232 play divergent roles toward different substrates.Biochem Biophys Res Commun. 2017 Feb 26;484(1):40-44. doi: 10.1016/j.bbrc.2017.01.081. Epub 2017 Jan 19. Biochem Biophys Res Commun. 2017. PMID: 28109884
-
Structure and heme binding properties of Escherichia coli O157:H7 ChuX.Protein Sci. 2009 Apr;18(4):825-38. doi: 10.1002/pro.84. Protein Sci. 2009. PMID: 19319934 Free PMC article.
-
Basidiomycete DyPs: Genomic diversity, structural-functional aspects, reaction mechanism and environmental significance.Arch Biochem Biophys. 2015 May 15;574:66-74. doi: 10.1016/j.abb.2015.01.018. Epub 2015 Jan 28. Arch Biochem Biophys. 2015. PMID: 25637654 Review.
-
Substrate binding and catalysis in heme peroxidases.Curr Opin Chem Biol. 1998 Apr;2(2):269-78. doi: 10.1016/s1367-5931(98)80069-0. Curr Opin Chem Biol. 1998. PMID: 9667928 Review.
Cited by
-
Characterization of Dye-decolorizing Peroxidase (DyP) from Thermomonospora curvata Reveals Unique Catalytic Properties of A-type DyPs.J Biol Chem. 2015 Sep 18;290(38):23447-63. doi: 10.1074/jbc.M115.658807. Epub 2015 Jul 23. J Biol Chem. 2015. PMID: 26205819 Free PMC article.
-
Characterization of Class V DyP-Type Peroxidase SaDyP1 from Streptomyces avermitilis and Evaluation of SaDyPs Expression in Mycelium.Int J Mol Sci. 2021 Aug 12;22(16):8683. doi: 10.3390/ijms22168683. Int J Mol Sci. 2021. PMID: 34445389 Free PMC article.
-
Characterization of a Mycobacterium tuberculosis nanocompartment and its potential cargo proteins.J Biol Chem. 2014 Jun 27;289(26):18279-89. doi: 10.1074/jbc.M114.570119. Epub 2014 May 22. J Biol Chem. 2014. PMID: 24855650 Free PMC article.
-
Distal heme pocket residues of B-type dye-decolorizing peroxidase: arginine but not aspartate is essential for peroxidase activity.J Biol Chem. 2012 Mar 23;287(13):10623-10630. doi: 10.1074/jbc.M111.332171. Epub 2012 Feb 3. J Biol Chem. 2012. PMID: 22308037 Free PMC article.
-
Application of a novel alkali-tolerant thermostable DyP-type peroxidase from Saccharomonospora viridis DSM 43017 in biobleaching of eucalyptus kraft pulp.PLoS One. 2014 Oct 21;9(10):e110319. doi: 10.1371/journal.pone.0110319. eCollection 2014. PLoS One. 2014. PMID: 25333297 Free PMC article.
References
Publication types
MeSH terms
Substances
Associated data
- Actions
LinkOut - more resources
Full Text Sources
