

COX-2 blockade suppresses gliomagenesis by inhibiting myeloid-derived suppressor cells
- PMID: 21324923
- PMCID: PMC3075086
- DOI: 10.1158/0008-5472.CAN-10-3055
COX-2 blockade suppresses gliomagenesis by inhibiting myeloid-derived suppressor cells
Abstract
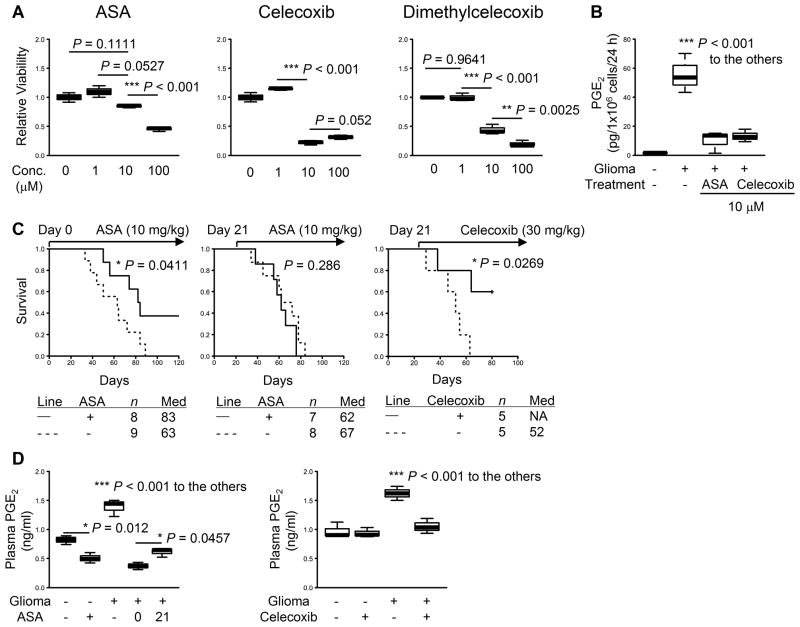
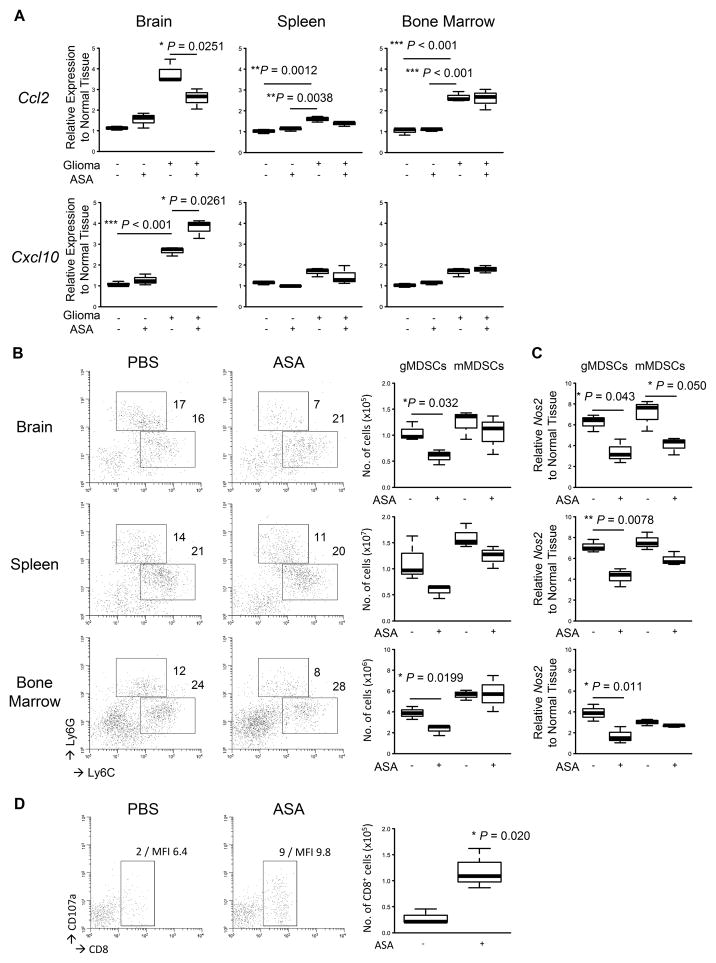
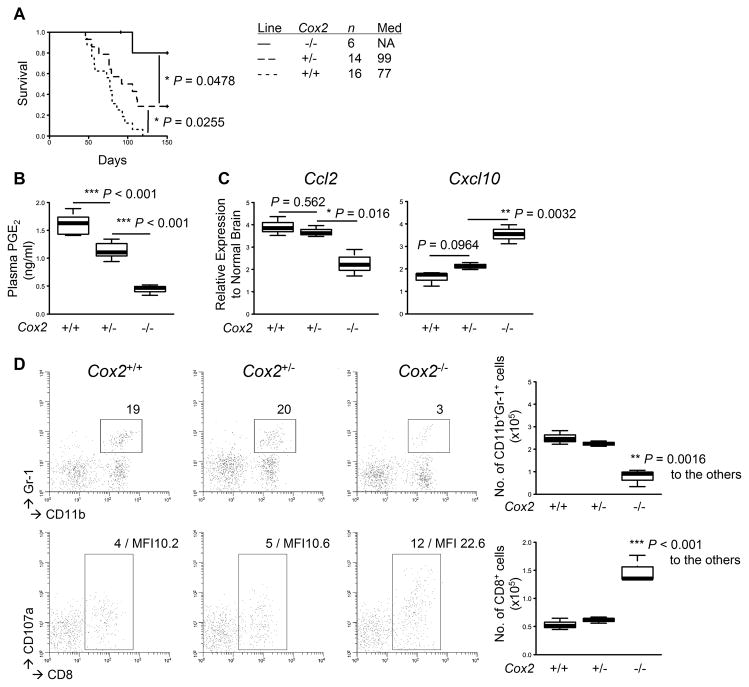
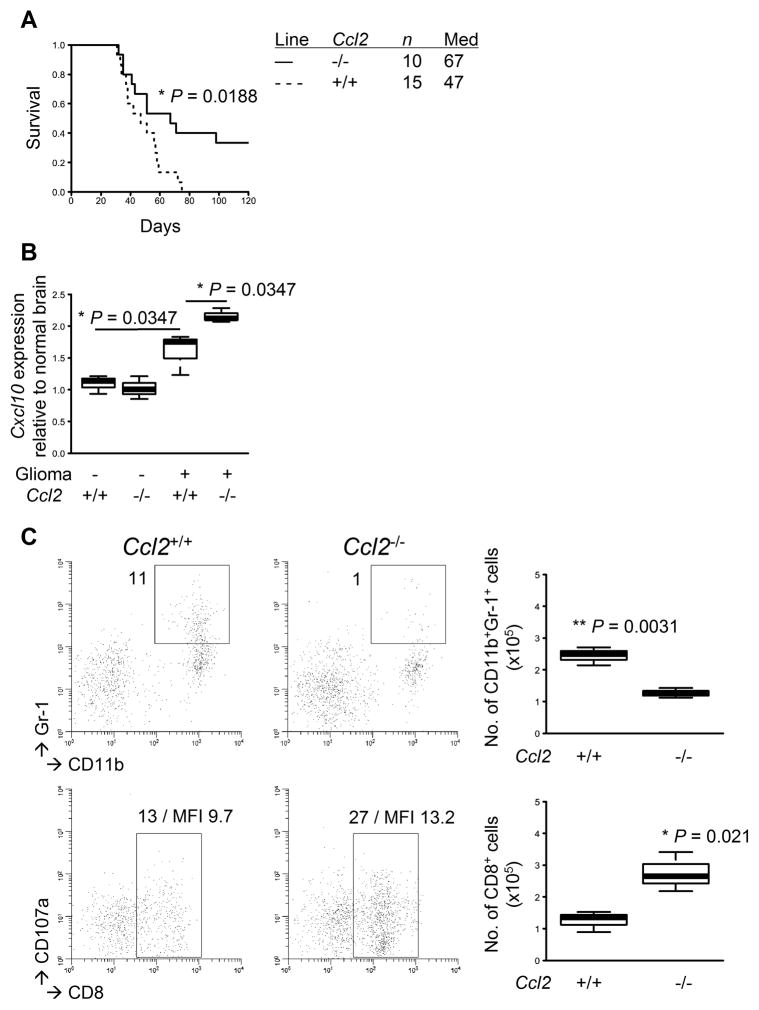
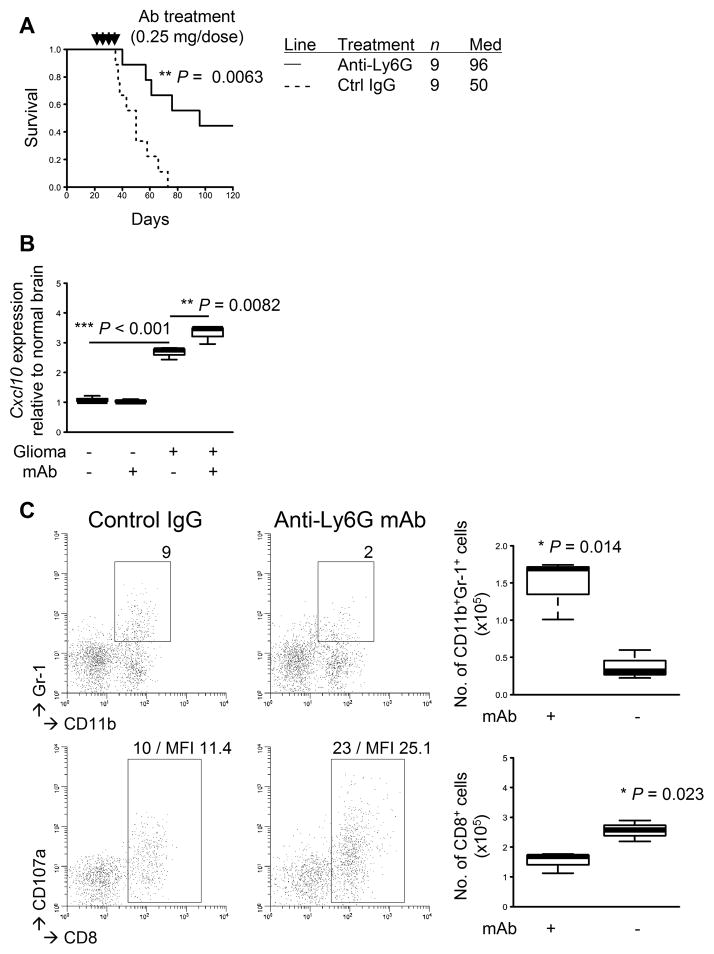
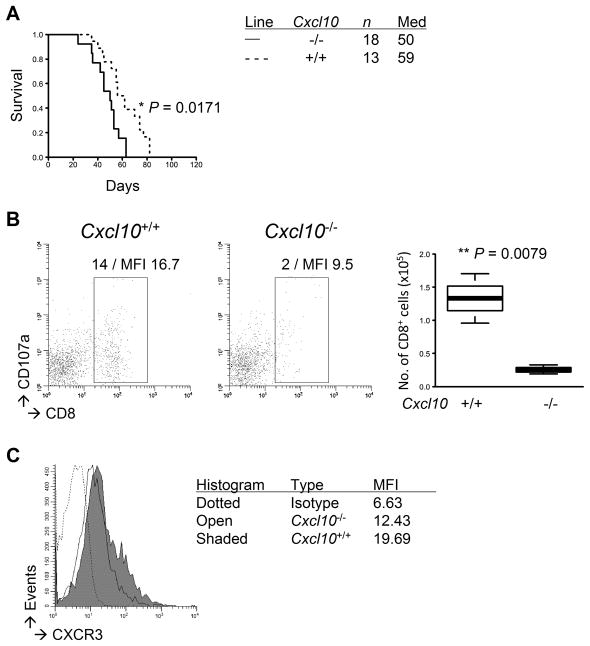
Epidemiologic studies have highlighted associations between the regular use of nonsteroidal anti-inflammatory drugs (NSAID) and reduced glioma risks in humans. Most NSAIDs function as COX-2 inhibitors that prevent production of prostaglandin E₂ (PGE₂). Because PGE₂ induces expansion of myeloid-derived suppressor cells (MDSC), we hypothesized that COX-2 blockade would suppress gliomagenesis by inhibiting MDSC development and accumulation in the tumor microenvironment (TME). In mouse models of glioma, treatment with the COX-2 inhibitors acetylsalicylic acid (ASA) or celecoxib inhibited systemic PGE₂ production and delayed glioma development. ASA treatment also reduced the MDSC-attracting chemokine CCL2 (C-C motif ligand 2) in the TME along with numbers of CD11b(+)Ly6G(hi)Ly6C(lo) granulocytic MDSCs in both the bone marrow and the TME. In support of this evidence that COX-2 blockade blocked systemic development of MDSCs and their CCL2-mediated accumulation in the TME, there were defects in these processes in glioma-bearing Cox2-deficient and Ccl2-deficient mice. Conversely, these mice or ASA-treated wild-type mice displayed enhanced expression of CXCL10 (C-X-C motif chemokine 10) and infiltration of cytotoxic T lymphocytes (CTL) in the TME, consistent with a relief of MDSC-mediated immunosuppression. Antibody-mediated depletion of MDSCs delayed glioma growth in association with an increase in CXCL10 and CTLs in the TME, underscoring a critical role for MDSCs in glioma development. Finally, Cxcl10-deficient mice exhibited reduced CTL infiltration of tumors, establishing that CXCL10 limited this pathway of immunosuppression. Taken together, our findings show that the COX-2 pathway promotes gliomagenesis by directly supporting systemic development of MDSCs and their accumulation in the TME, where they limit CTL infiltration.
Figures
Similar articles
-
PGE(2)-induced CXCL12 production and CXCR4 expression controls the accumulation of human MDSCs in ovarian cancer environment.Cancer Res. 2011 Dec 15;71(24):7463-70. doi: 10.1158/0008-5472.CAN-11-2449. Epub 2011 Oct 24. Cancer Res. 2011. PMID: 22025564 Free PMC article.
-
Combination of an agonistic anti-CD40 monoclonal antibody and the COX-2 inhibitor celecoxib induces anti-glioma effects by promotion of type-1 immunity in myeloid cells and T-cells.Cancer Immunol Immunother. 2014 Aug;63(8):847-57. doi: 10.1007/s00262-014-1561-8. Epub 2014 May 31. Cancer Immunol Immunother. 2014. PMID: 24878890 Free PMC article.
-
COX-2 inhibition improves immunotherapy and is associated with decreased numbers of myeloid-derived suppressor cells in mesothelioma. Celecoxib influences MDSC function.BMC Cancer. 2010 Aug 30;10:464. doi: 10.1186/1471-2407-10-464. BMC Cancer. 2010. PMID: 20804550 Free PMC article.
-
Myeloid derived suppressor cells-An overview of combat strategies to increase immunotherapy efficacy.Oncoimmunology. 2015 Feb 3;4(1):e954829. doi: 10.4161/21624011.2014.954829. eCollection 2015 Jan. Oncoimmunology. 2015. PMID: 25949858 Free PMC article. Review.
-
PGE(2)-driven induction and maintenance of cancer-associated myeloid-derived suppressor cells.Immunol Invest. 2012;41(6-7):635-57. doi: 10.3109/08820139.2012.695417. Immunol Invest. 2012. PMID: 23017139 Review.
Cited by
-
Potential therapeutic anti-tumor effect of a Salmonella-based vaccine.Hum Vaccin Immunother. 2013 Aug;9(8):1654-60. doi: 10.4161/hv.24917. Epub 2013 Jun 3. Hum Vaccin Immunother. 2013. PMID: 23733040 Free PMC article. Review.
-
Tumor-derived G-CSF facilitates neoplastic growth through a granulocytic myeloid-derived suppressor cell-dependent mechanism.PLoS One. 2011;6(11):e27690. doi: 10.1371/journal.pone.0027690. Epub 2011 Nov 16. PLoS One. 2011. PMID: 22110722 Free PMC article.
-
Endogenous PGE(2) induces MCP-1 expression via EP4/p38 MAPK signaling in melanoma.Oncol Lett. 2013 Feb;5(2):645-650. doi: 10.3892/ol.2012.1047. Epub 2012 Nov 27. Oncol Lett. 2013. PMID: 23420676 Free PMC article.
-
Microglia-Based Gene Expression Signature Highly Associated with Prognosis in Low-Grade Glioma.Cancers (Basel). 2022 Sep 30;14(19):4802. doi: 10.3390/cancers14194802. Cancers (Basel). 2022. PMID: 36230719 Free PMC article.
-
Emerging evidence of anti-tumor immune control in the central nervous system.Oncoimmunology. 2012 Dec 1;1(9):1648-1649. doi: 10.4161/onci.21747. Oncoimmunology. 2012. PMID: 23264924 Free PMC article.
References
-
- Sivak-Sears NR, Schwartzbaum JA, Miike R, Moghadassi M, Wrensch M. Case-control study of use of nonsteroidal antiinflammatory drugs and glioblastoma multiforme. Am J Epidemiol. 2004;159:1131–9. - PubMed
-
- Ochoa AC, Zea AH, Hernandez C, Rodriguez PC. Arginase, prostaglandins, and myeloid-derived suppressor cells in renal cell carcinoma. Clin Cancer Res. 2007;13:721s–6s. - PubMed
-
- Sinha P, Clements VK, Fulton AM, Ostrand-Rosenberg S. Prostaglandin E2 promotes tumor progression by inducing myeloid-derived suppressor cells. Cancer Res. 2007;67:4507–13. - PubMed
Publication types
MeSH terms
Substances
Grants and funding
LinkOut - more resources
Full Text Sources
Other Literature Sources
Molecular Biology Databases
Research Materials
