. 2011 Apr;13(4):401-9.
doi: 10.1093/neuonc/noq206. Epub 2011 Feb 15.

Quantitative volumetric analysis of conventional MRI response in recurrent glioblastoma treated with bevacizumab

Affiliations

Quantitative volumetric analysis of conventional MRI response in recurrent glioblastoma treated with bevacizumab

Benjamin M Ellingson et al. Neuro Oncol. 2011 Apr.

Abstract

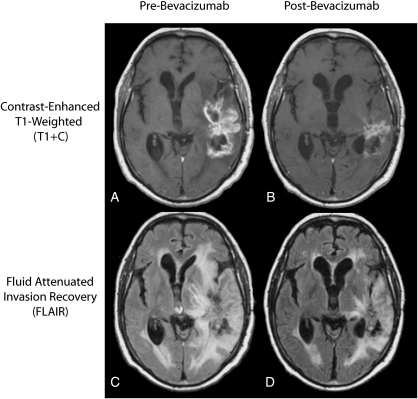
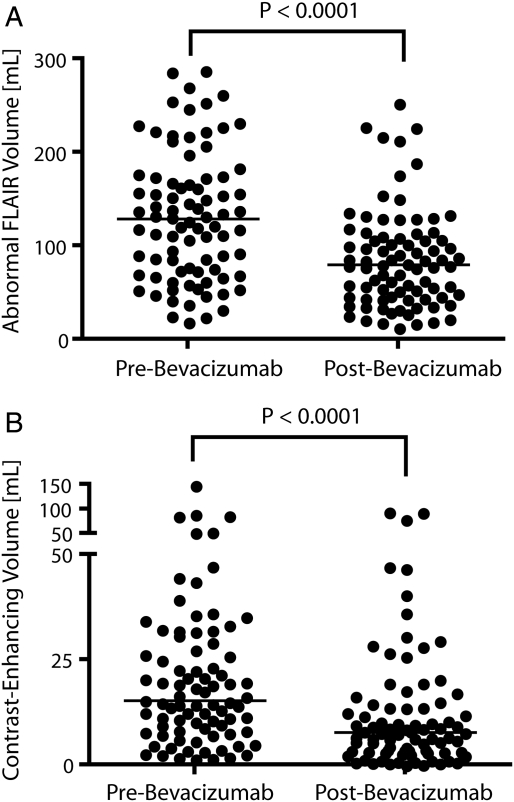
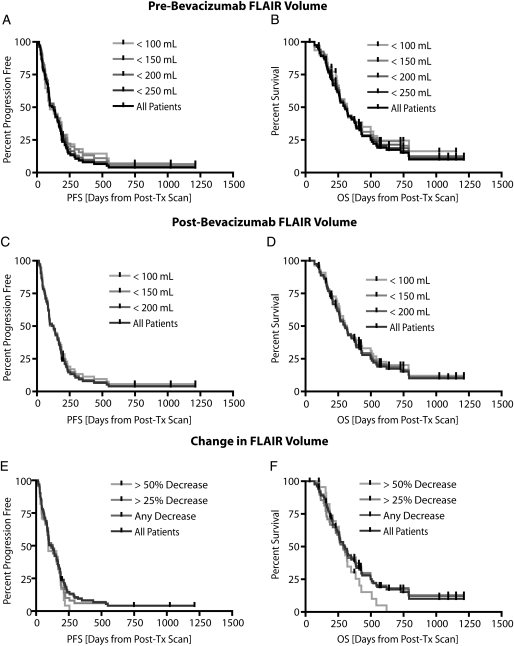
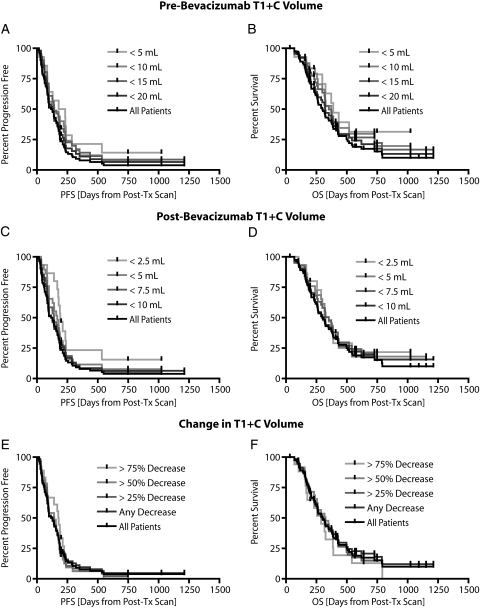
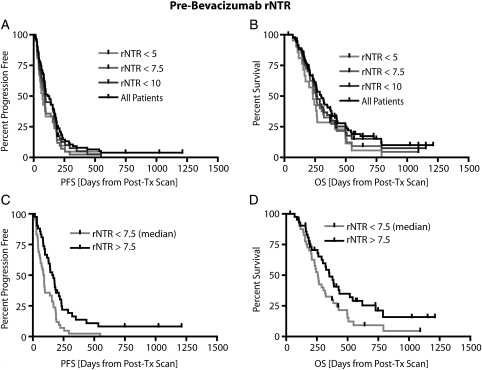
Although the effects of bevacizumab on magnetic resonance images (MRIs) of recurrent glioblastoma multiforme (GBM) are well documented, to our knowledge, no studies have explicitly quantified the volumetric changes resulting from initial treatment, nor have there been studies examining the ability for volumetric changes in conventional MRI to predict progression-free survival (PFS) and overall survival (OS). In the current study, we retrospectively examined volumetric changes on conventional MRI scans in 84 patients with recurrent GBM. MRIs were obtained before (mean, 11 days) and after (mean, 42 days) treatment with bevacizumab. The volume of abnormal fluid-attenuated inversion recovery (FLAIR) signal intensity, the volume of contrast enhancement, and the ratio of the 2 were quantified for each patient before and after initial treatment. Results demonstrated that initial treatment with bevacizumab resulted in a significant decrease in both the volume of abnormal FLAIR signal and the volume of contrast enhancement. Initial, residual, and change in FLAIR volume were not predictive of PFS or OS. Initial contrast-enhancing volume was predictive of PFS but not OS. The pretreatment relative nonenhancing tumor ratio, defined as the ratio of FLAIR to contrast-enhancing volume, was found to be predictive of both PFS and OS.


Figures

Fig. 1.
Fig. 1.
Typical change in standard MR images of glioblastoma multiforme after treatment with bevacizumab. (A) Pretreatment contrast-enhanced T1-weighted image. (B) Post-treatment contrast–enhanced T1-weighted image showing a decrease in extent of contrast-enhancement. (C) Pretreatment fluid-attenuated inversion recovery (FLAIR) image. (D) Posttreatment FLAIR image showing reduction of vasogenic edema relative to pre-treatment FLAIR images.
Fig. 2.
Fig. 2.
Volumetric analysis of fluid-attenuated inversion recovery (FLAIR) and contrast-enhanced MRI before and after bevacizumab treatment. (A) Pretreatment abnormal FLAIR volume. (B) Posttreatment abnormal FLAIR volume. (C) Pretreatment contrast-enhancing volume. (D) Posttreatment contrast-enhancing volume. Results show significant reduction in both FLAIR and contrast-enhancement after bevacizumab therapy (P < .0001, by Wilcoxon signed rank test).
Fig. 3.
Fig. 3.
Pretreatment fluid-attenuated inversion recovery (FLAIR) volume, posttreatment FLAIR volume, and change in FLAIR volume versus progression-free survival (PFS) and overall survival (OS) in recurrent glioblastoma multiforme treated with bevacizumab. (A) PFS for pretreatment FLAIR volumes ranging from 100 mL to 250 mL showing no significant trends (P = .3102, by log-rank test for trends). (B) OS for pretreatment FLAIR volumes ranging from 100 mL to 250 mL showing no significant trends (P = .3599, by log-rank test for trends). (C) PFS for posttreatment FLAIR volumes ranging from 100 mL to 200 mL showing no significant trends (P = .5825, by log-rank test for trends). (D) OS for posttreatment FLAIR volumes ranging from 100 mL to 200 mL showing no statistically significant trends (P = .5714, by log-rank test for trends). (E) Patients showing a change in FLAIR volume more than 25% and 50% were not predictive of PFS (P = .2822, by log-rank test for trends). (F) Patients having a change in FLAIR volume more than 25% and 50% were also not predictive of OS (P = .4664, by log-rank test for trends). Post-Tx, post-treatment.
Fig. 4.
Fig. 4.
Pretreatment contrast-enhancing volume, posttreatment contrast-enhancing volume, and change in contrast-enhancing volume versus progression-free survival (PFS) and overall survival (OS). (A) Pretreatment contrast-enhancing volumes ranging from 5mL to 20mL showing a significant trend with respect to PFS (P = .0309, by log-rank test for trends). (B) Pretreatment contrast-enhancing volumes ranging from 5 mL to 20 mL not showing any trends with respect to OS (P = .0601, by log-rank test for trends). (C) Posttreatment contrast-enhancing volumes ranging from 2.5 mL to 10 mL showing a significant trend with respect to PFS (P = .0225, by log-rank test for trends). (D) Posttreatment contrast-enhancing volumes ranging from 2.5 mL to 10 mL not showing significant trends with respect to OS (P = .3422, by log-rank test for trends). (E) No trends in PFS for decrease in contrast-enhancing volumes of 25%, 50%, and 75% were observed (P = .7426, by log-rank test for trends). (F) No trends in OS for decrease in contrast-enhancing volumes of 25%, 50%, and 75% were observed (P = .6202, by log-rank test for trends).
Fig. 5.
Fig. 5.
Relationship between pretreatment relative non-enhancing tumor ratio (rNTR) and patient survival. (A) No significant trends observed between pre-treatment rNTR ranging from 5 to 10 and progression-free survival (PFS; P = .0577, by log-rank test for trends). (B) Similarly, no significant trends were observed between pretreatment rNTR ranging from 5 to 10 and overall survival (OS; P = .0762, by log-rank test for trends). (C) Patient stratification based on median rNTR (7.5) showing significant differences in PFS (P = .0023, by log-rank test). (D) Patient stratification based on median rNTR (7.5) also showed a significant difference in OS (P = .0440, by log-rank test).

References

    1. Plate KH, Breier G, Risau W. Molecular mechanisms of developmental and tumor angiogenesis. Brain Pathol. 1994;4(3):207–218. - PubMed
    1. Holash J, Maisonpierre PC, Compton D, et al. Vessel cooption, regression, and growth in tumors mediated by angiopoietins and VEGF. Science. 1999;284(5422):1994–1998. - PubMed
    1. Duda DG, Batchelor TT, Willett CG, Jain RK. VEGF-targeted cancer therapy strategies: current progress, hurdles and future prospects. Trends Mol Med. 2007;13(6):223–230. - PMC - PubMed
    1. Nghiemphu PL, Liu W, Lee Y, et al. Bevacizumab and chemotherapy for recurrent glioblastoma: a single-institution experience. Neurology. 2009;72(14):1217–1222. - PMC - PubMed
    1. Vredenburgh JJ, Desjardins A, Herndon JE, et al. Phase II trial of bevacizumab and irinotecan in recurrent malignant glioma. Clin Cancer Res. 2007;13(1253–9) - PubMed

Publication types