. 2011 Mar 8;108(10):4047-52.
doi: 10.1073/pnas.1013499108. Epub 2011 Feb 15.

The population dynamics of bacteria in physically structured habitats and the adaptive virtue of random motility

Affiliations

The population dynamics of bacteria in physically structured habitats and the adaptive virtue of random motility

Yan Wei et al. Proc Natl Acad Sci U S A. .

Abstract

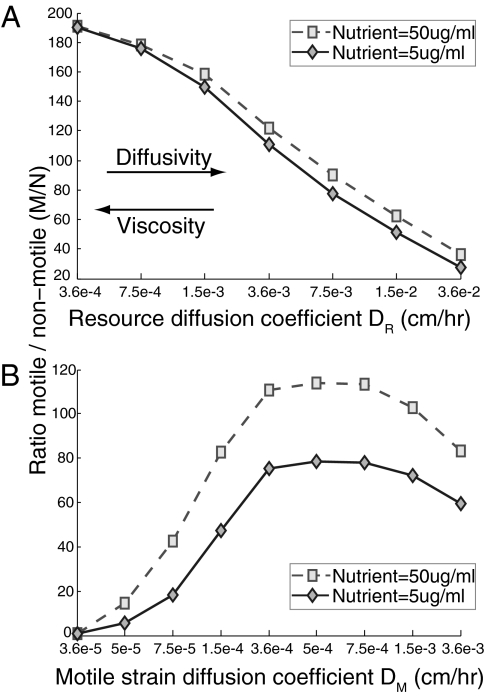
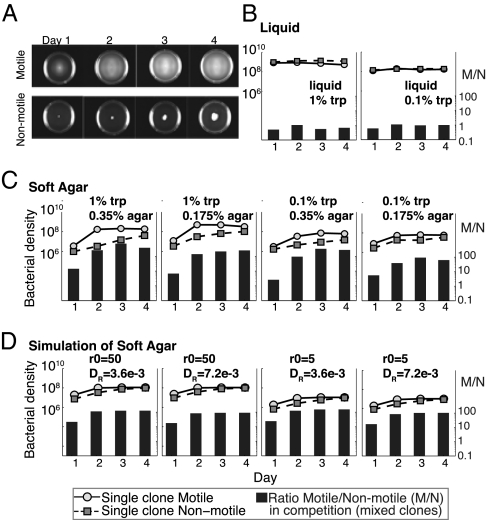
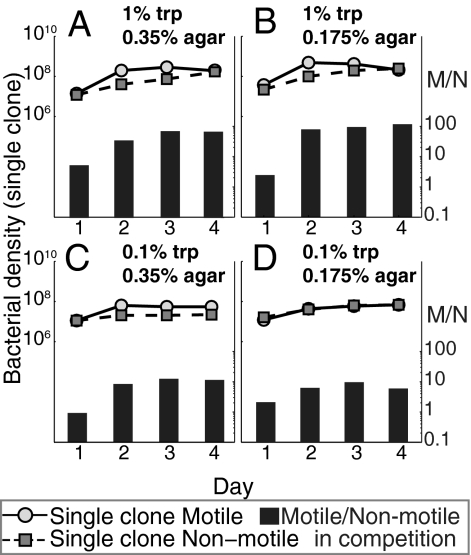
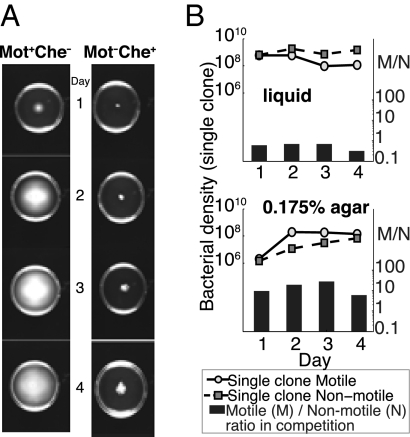
Why is motility so common in bacteria? An obvious answer to this ecological and evolutionary question is that in almost all habitats, bacteria need to go someplace and particularly in the direction of food. Although the machinery required for motility and chemotaxis (acquiring and processing the information needed to direct movement toward nutrients) are functionally coupled in contemporary bacteria, they are coded for by different sets of genes. Moreover, information that resources are more abundant elsewhere in a habitat would be of no value to a bacterium unless it already had the means to get there. Thus, motility must have evolved before chemotaxis, and bacteria with flagella and other machinery for propulsion in random directions must have an advantage over bacteria relegated to moving at the whim of external forces alone. However, what are the selection pressures responsible for the evolution and maintenance of undirected motility in bacteria? Here we use a combination of mathematical modeling and experiments with Escherichia coli to generate and test a parsimonious and ecologically general hypothesis for the existence of undirected motility in bacteria: it enables bacteria to move away from each other and thereby obtain greater individual shares of resources in physically structured environments. The results of our experiments not only support this hypothesis, but are quantitatively and qualitatively consistent with the predictions of our model.


Conflict of interest statement

The authors declare no conflict of interest.

Figures

Fig. 1.
Fig. 1.
Simulation of competition between motile and nonmotile cells in homogenous habitats with two different levels of resource. Parameters common to both plots are α = 0.90 h−1, k = 5.0 μg/mL, ν = 4.75 × 10⁻⁷ μg, and dt = 0.1 h−1. The computations used a grid size of 0.1 cm and cell densities and M/N ratios were computed at the tick marks shown. (A) Ratio of motile to nonmotile cells for different resource diffusion coefficients DR. A higher resource diffusion constant leads to less spatial variation in resource concentration DM =3.19 × 10⁻⁴ and DN =3.6 × 10⁻⁵ cm/h. (B) Ratio of motile to nonmotile cells for different motile strain diffusion coefficients DM assuming DR = 3.6 × 10⁻³ and DN = 3.6 × 10⁻⁵ cm/h.
Fig. 2.
Fig. 2.
(A) Growth of motile and nonmotile strains in 35-mm diameter Petri dishes with 1% tryptone, 0.35% agar medium. (B) Change in density of motile and nonmotile strains in single-clone culture and ratio of motile/nonmotile cells (M/N in right axis) in pairwise competition in liquid culture with different amounts of nutrient (1% and 0.1% tryptone). Mean densities were estimated for three separate dilutions from two independent experiments. Initially there were 20–50 cells/mL and M/N ratios of 0.6–0.7. (C) Change in density of motile and nonmotile strains in single-clone culture and ratio of motile/nonmotile cells (M/N in right axis) in pairwise competition in soft agar culture with different amounts of nutrient (1% and 0.1% tryptone) and different viscosities of agar (0.35% and 0.175%). Mean densities were estimated for three separate dilutions from two independent experiments. Initially there were 20–50 cells/mL and M/N ratios of 0.6–0.7. (See Methods for information about the error in these estimates of densities and ratios in this and the following figures.) (D) Simulation results, change in density of motile and nonmotile strains in single-clone culture and ratio of motile/nonmotile cells (M/N in right axis) in pairwise competition in soft agar culture with different amounts of nutrient (Rmax = 5 and 50 μg/mL) and resource diffusion coefficients (DR = 3.6 × 10⁻³ and 7.2 × 10⁻³ cm/h). Simulation parameters: α = 0.9 h−1, k = 5.0 mg/mL, ν = 4.75 × 10⁻⁷ μg/h, DM =3.19 × 10⁻⁴ cm/h, and DN = 3.6 × 10⁻³ cm/h. The computations used a grid size of 0.1 cm and a step size of 0.1 h−1.
Fig. 3.
Fig. 3.
(A–D) Change in density of motile and nonmotile strains in single-clone culture and ratio of motile/nonmotile cells (M/N in right axis) in pairwise competition in soft agar with different amounts of nutrient (1% and 0.1% tryptone) and different viscosities of agar (0.35% and 0.175%). Mean densities were estimated for three separate dilutions from two independent experiments. Cultures were initiated with 20–50 cells randomly dispersed in agar and M/N ratios of 0.6–1.0.
Fig. 4.
Fig. 4.
Growth and competitive performance of two strains of E. coli PS2001: motile chemotactic negative and nonmotile chemotactic positive. Strains were grown in 1% tryptone liquid and in 0.175% soft agar medium. (A) Growth and dispersion of motile chemotactic negative (Mot+Che) and nonmotile chemotactic positive (MotChe+) cells in 35-mm diameter Petri dishes. (B) Change in density of motile and nonmotile strains in single-clone culture and ratio of motile/nonmotile cells (M/N in right axis) in pairwise competition in liquid and soft agar. Mean densities were estimated for three separate dilutions from two independent experiments. Initially there were 20–50 cells/mL and M/N ratios of 0.6–0.7.

References

    1. Dinsdale EA, et al. Functional metagenomic profiling of nine biomes. Nature. 2008;452:629–632. - PubMed
    1. Harrington ED, et al. Quantitative assessment of protein function prediction from metagenomics shotgun sequences. Proc Natl Acad Sci USA. 2007;104:13913–13918. - PMC - PubMed
    1. NCBI-NIH . NCBI Prokaryotic Genomes. Bethesda: National Center for Biotechnology Information, National Institutes of Health; 2010.
    1. Falke JJ, Bass RB, Butler SL, Chervitz SA, Danielson MA. The two-component signaling pathway of bacterial chemotaxis: A molecular view of signal transduction by receptors, kinases, and adaptation enzymes. Annu Rev Cell Dev Biol. 1997;13:457–512. - PMC - PubMed
    1. Wadhams GH, Armitage JP. Making sense of it all: Bacterial chemotaxis. Nat Rev Mol Cell Biol. 2004;5:1024–1037. - PubMed

Publication types