. 2011 Aug;28(8):2239-52.
doi: 10.1093/molbev/msr048. Epub 2011 Feb 15.

Testing for ancient admixture between closely related populations

Affiliations

Testing for ancient admixture between closely related populations

Eric Y Durand et al. Mol Biol Evol. 2011 Aug.

Abstract

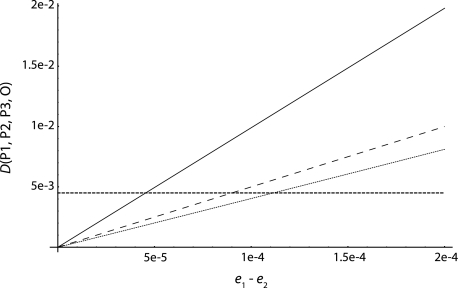
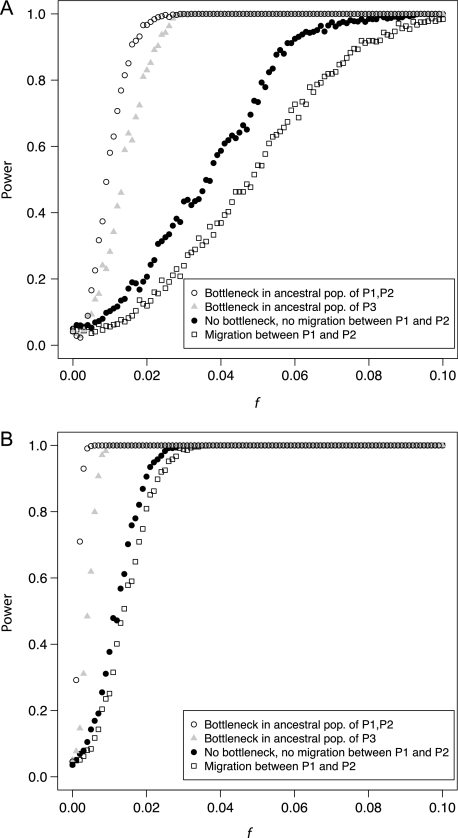
One enduring question in evolutionary biology is the extent of archaic admixture in the genomes of present-day populations. In this paper, we present a test for ancient admixture that exploits the asymmetry in the frequencies of the two nonconcordant gene trees in a three-population tree. This test was first applied to detect interbreeding between Neandertals and modern humans. We derive the analytic expectation of a test statistic, called the D statistic, which is sensitive to asymmetry under alternative demographic scenarios. We show that the D statistic is insensitive to some demographic assumptions such as ancestral population sizes and requires only the assumption that the ancestral populations were randomly mating. An important aspect of D statistics is that they can be used to detect archaic admixture even when no archaic sample is available. We explore the effect of sequencing error on the false-positive rate of the test for admixture, and we show how to estimate the proportion of archaic ancestry in the genomes of present-day populations. We also investigate a model of subdivision in ancestral populations that can result in D statistics that indicate recent admixture.


Figures

F<sc>IG</sc>. 1.
FIG. 1.
There are three possible topologies of the gene genealogies, I, II, and III, that can relate samples P1, P2, and P3, and the outgroup O. Assuming that any polymorphisms reflect a single historical mutation, ABBA sites can occur only on a type III gene genealogy due to a mutation that occurs on the branch ancestral to samples P2 and P3 (IIIc), and BABA sites can occur only on a type II gene genealogy due to a mutation on the branch ancestral to samples P1 and P3 (IIc).
F<sc>IG</sc>. 2.
FIG. 2.
Model of IUA. P1 and P2 split at time tP2. P3 splits from the ancestral population of P1 and P2, denoted P(12), at time tP3. A single episode of admixture takes place from P3 to P2 at time tGF. We denote by f the admixture proportion, which is the proportion of P3 ancestry in P2 individuals at time tGF. We denote by N3(t), N(12)(t), and N(123)(t) the size of populations P3, P(12), and P(123) at generation t in the past. The sizes of populations P1 and P2 do not influence D statistics.
F<sc>IG</sc>. 3.
FIG. 3.
Model of ancient subdivision (AS). P1 and P2 definitively split at time tP2. The ancestral population of P1 and P2 is subdivided in two subpopulations, denoted P(12),1 and P(12),2. The two subpopulations exchange migrants at rate m. P3 splits at time tP3. The subdivision persists in the ancestral population of P(12),1, P(12),2, and P3. We denote by P(123),1 the population ancestral to P(12),1 and by P(123),2 the ancestral population of P(12),2. These two subpopulations exchange migrants at rate m. Subpopulations merge at time T > tP3. All population sizes are constant and equal to N.
F<sc>IG</sc>. 4.
FIG. 4.
D statistics and expected coalescence time of P2 and P3 under the IUA and AS models. We assumed parameter values of tGF = 2,500, tP2 = 3,000, tP3 = 12,000, T = 25,000 (times in generations), and a constant ancestral population size equal to N = 10,000. (A) D(P1, P2, P3, O) as a function of f (IUA) and 2Nm (AS). (B) Expected internal branch length (IBL) for topologies where P2 and P3 coalesced first as a function of f (IUA) and 2Nm (AS). The rescaling for 2Nm on (A) and (B) was chosen so that 2Nm and f vary in the same range.
F<sc>IG</sc>. 5.
FIG. 5.
D(P1, P2, P3, O) as a function of the sequencing error difference e1e2. The dotted curve assumes that the probability to have an error in two populations is equal to the product of sequencing errors in the two populations (eij = ei × ej). The dashed curve corresponds to eij = min(ei, ej)/10, and the solid line assumes eij = min(ei, ej). The horizontal dashed line corresponds to twice the standard error of D, assuming that sites are independent.
F<sc>IG</sc>. 6.
FIG. 6.
Power of the test for admixture. We simulated (A) 10,000 unlinked polymorphic sites and (B) 100,000 unlinked polymorphic sites. Dots: no bottleneck and no migration between P1 and P2. Circles: bottleneck in the ancestral population of P1 and P2. Grey triangles: bottleneck in P3. Squares: ongoing migration between P1 and P2 at rate 2Nm = 0.5. All bottlenecks involved a 100-fold reduction in population size and lasted 1,000 generations. They started at 3,500 generations in the past.

References

    1. Barton N. The role of hybridization in evolution. Mol Ecol. 2001;10:551–568. - PubMed
    1. Barton N, Hewitt G. Analysis of hybrid zones. Annu Rev Ecol Syst. 1985;16:113–148.
    1. Clark AG, Hubisz MJ, Bustamante CD, Williamson SH, Nielsen R. Ascertainment bias in studies of human genome-wide polymorphism. Genome Res. 2005;15(11):1496–1502. - PMC - PubMed
    1. Currat M, Excoffier L. Modern humans did not admix with Neanderthals during their range expansion into Europe. PLoS Biol. 2004;2(12):e421. - PMC - PubMed
    1. Currat M, Ruedi M, Petit RJ, Excoffier L. The hidden side of invasions: massive introgression by local genes. Evolution. 2008;62(8):1908–1920. - PubMed

Publication types