

Scanning ion conductance microscopy: a convergent high-resolution technology for multi-parametric analysis of living cardiovascular cells
- PMID: 21325316
- PMCID: PMC3104336
- DOI: 10.1098/rsif.2010.0597
Scanning ion conductance microscopy: a convergent high-resolution technology for multi-parametric analysis of living cardiovascular cells
Abstract
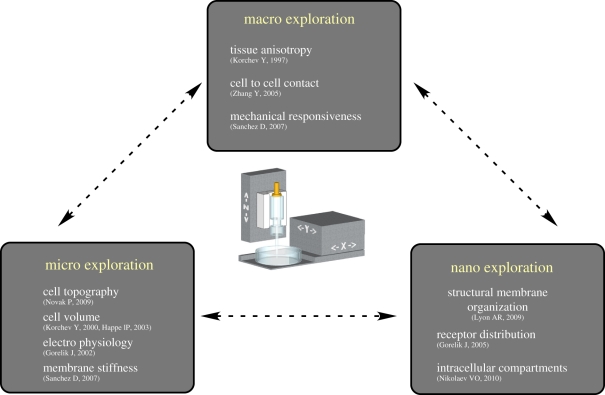
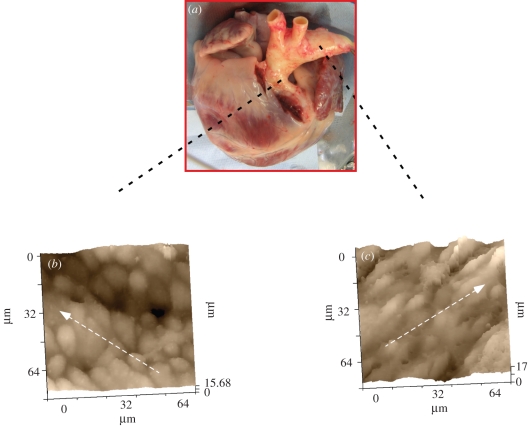
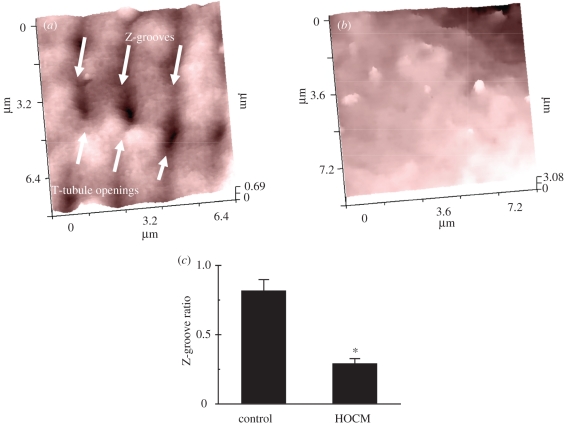
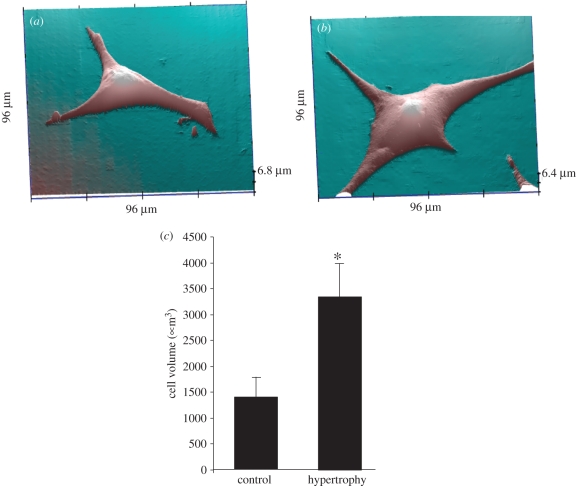
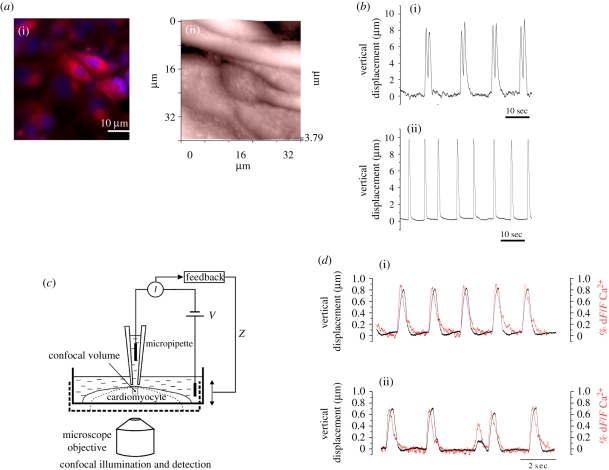
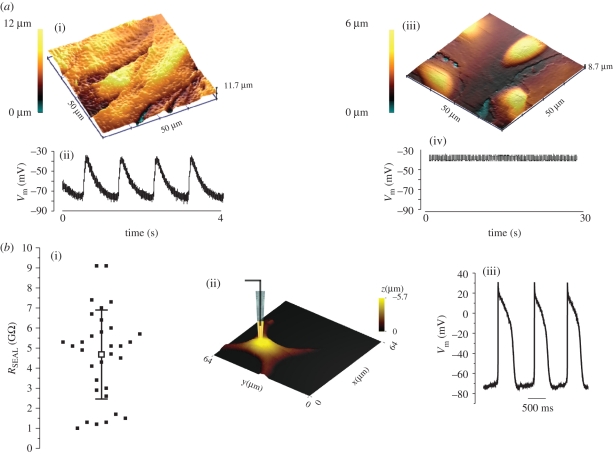
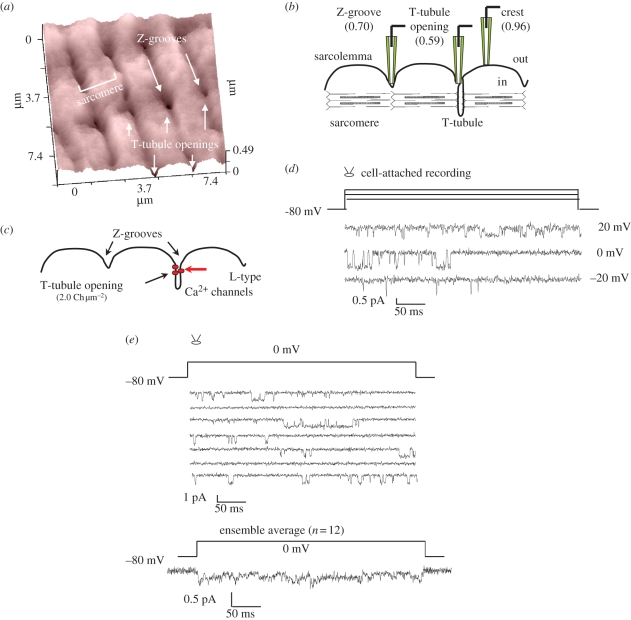
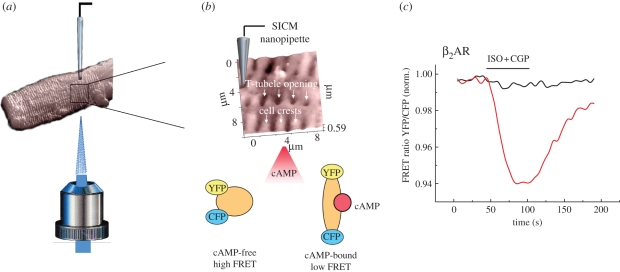
Cardiovascular diseases are complex pathologies that include alterations of various cell functions at the levels of intact tissue, single cells and subcellular signalling compartments. Conventional techniques to study these processes are extremely divergent and rely on a combination of individual methods, which usually provide spatially and temporally limited information on single parameters of interest. This review describes scanning ion conductance microscopy (SICM) as a novel versatile technique capable of simultaneously reporting various structural and functional parameters at nanometre resolution in living cardiovascular cells at the level of the whole tissue, single cells and at the subcellular level, to investigate the mechanisms of cardiovascular disease. SICM is a multimodal imaging technology that allows concurrent and dynamic analysis of membrane morphology and various functional parameters (cell volume, membrane potentials, cellular contraction, single ion-channel currents and some parameters of intracellular signalling) in intact living cardiovascular cells and tissues with nanometre resolution at different levels of organization (tissue, cellular and subcellular levels). Using this technique, we showed that at the tissue level, cell orientation in the inner and outer aortic arch distinguishes atheroprone and atheroprotected regions. At the cellular level, heart failure leads to a pronounced loss of T-tubules in cardiac myocytes accompanied by a reduction in Z-groove ratio. We also demonstrated the capability of SICM to measure the entire cell volume as an index of cellular hypertrophy. This method can be further combined with fluorescence to simultaneously measure cardiomyocyte contraction and intracellular calcium transients or to map subcellular localization of membrane receptors coupled to cyclic adenosine monophosphate production. The SICM pipette can be used for patch-clamp recordings of membrane potential and single channel currents. In conclusion, SICM provides a highly informative multimodal imaging platform for functional analysis of the mechanisms of cardiovascular diseases, which should facilitate identification of novel therapeutic strategies.
Figures
Similar articles
-
Recording single-channel currents using "smart patch-clamp" technique.Methods Mol Biol. 2013;998:189-97. doi: 10.1007/978-1-62703-351-0_14. Methods Mol Biol. 2013. PMID: 23529430
-
[High-resolution patch-clamp technique based on feedback control of scanning ion conductance microscopy].Sheng Li Xue Bao. 2010 Jun 25;62(3):275-83. Sheng Li Xue Bao. 2010. PMID: 20571746 Chinese.
-
Ultrafast Imaging of Cardiomyocyte Contractions by Combining Scanning Ion Conductance Microscopy with a Microelectrode Array.Anal Chem. 2019 Aug 6;91(15):9648-9655. doi: 10.1021/acs.analchem.9b01092. Epub 2019 Jun 18. Anal Chem. 2019. PMID: 31247725
-
Scanning ion conductance microscopy for studying biological samples.Sensors (Basel). 2012 Nov 6;12(11):14983-5008. doi: 10.3390/s121114983. Sensors (Basel). 2012. PMID: 23202197 Free PMC article. Review.
-
The scanning ion conductance microscope for cellular physiology.Am J Physiol Heart Circ Physiol. 2013 Jan 1;304(1):H1-11. doi: 10.1152/ajpheart.00499.2012. Epub 2012 Oct 19. Am J Physiol Heart Circ Physiol. 2013. PMID: 23086993 Review.
Cited by
-
Scanning Ion Conductance Microscopy Study Reveals the Disruption of the Integrity of the Human Cell Membrane Structure by Oxidative DNA Damage.ACS Appl Bio Mater. 2021 Feb 15;4(2):1632-1639. doi: 10.1021/acsabm.0c01461. Epub 2021 Jan 13. ACS Appl Bio Mater. 2021. PMID: 34430802 Free PMC article.
-
Junction Mapper is a novel computer vision tool to decipher cell-cell contact phenotypes.Elife. 2019 Dec 3;8:e45413. doi: 10.7554/eLife.45413. Elife. 2019. PMID: 31793877 Free PMC article.
-
Contractility assessment in enzymatically isolated cardiomyocytes.Biophys Rev. 2012 Sep;4(3):231-243. doi: 10.1007/s12551-012-0082-y. Epub 2012 Sep 1. Biophys Rev. 2012. PMID: 28510074 Free PMC article. Review.
-
Plasticity of surface structures and β(2)-adrenergic receptor localization in failing ventricular cardiomyocytes during recovery from heart failure.Circ Heart Fail. 2012 May 1;5(3):357-65. doi: 10.1161/CIRCHEARTFAILURE.111.964692. Epub 2012 Mar 28. Circ Heart Fail. 2012. PMID: 22456061 Free PMC article.
-
Individual aggregates of amyloid beta induce temporary calcium influx through the cell membrane of neuronal cells.Sci Rep. 2016 Aug 24;6:31910. doi: 10.1038/srep31910. Sci Rep. 2016. PMID: 27553885 Free PMC article.
References
-
- Neher E., Sakmann B. 1976. Single-channel currents recorded from membrane of denervated frog muscle fibres. Nature 260, 799–80210.1038/260799a0 (doi:10.1038/260799a0) - DOI - DOI - PubMed
-
- Pillekamp F., Reppel M., Brockmeier K., Hescheler J. 2006. Impulse propagation in late-stage embryonic and neonatal murine ventricular slices. J. Electrocardiol. 39, 425 e1–e410.1016/j.jelectrocard.2006.02.008 (doi:10.1016/j.jelectrocard.2006.02.008) - DOI - DOI - PubMed
-
- Rossi S., et al. 2008. Ventricular activation is impaired in aged rat hearts. Am. J. Physiol. Heart Circ. Physiol. 295, H2336–H234710.1152/ajpheart.00517.2008 (doi:10.1152/ajpheart.00517.2008) - DOI - DOI - PubMed
-
- Miragoli M., Gaudesius G., Rohr S. 2006. Electrotonic modulation of cardiac impulse conduction by myofibroblasts. Circ. Res. 98, 801–81010.1161/01.RES.0000214537.44195.a3 (doi:10.1161/01.RES.0000214537.44195.a3) - DOI - DOI - PubMed
Publication types
MeSH terms
Grants and funding
- C19021/BB_/Biotechnology and Biological Sciences Research Council/United Kingdom
- WTN090594/WT_/Wellcome Trust/United Kingdom
- P13543/MRC_/Medical Research Council/United Kingdom
- RE/08/002/BHF_/British Heart Foundation/United Kingdom
- BB/D020875/1/BB_/Biotechnology and Biological Sciences Research Council/United Kingdom
LinkOut - more resources
Full Text Sources
Other Literature Sources
