Comparative Study
. 2011 May;85(9):4234-45.
doi: 10.1128/JVI.02395-10. Epub 2011 Feb 16.

Distinct severe acute respiratory syndrome coronavirus-induced acute lung injury pathways in two different nonhuman primate species

Affiliations
Comparative Study

Distinct severe acute respiratory syndrome coronavirus-induced acute lung injury pathways in two different nonhuman primate species

Saskia L Smits et al. J Virol. 2011 May.

Abstract

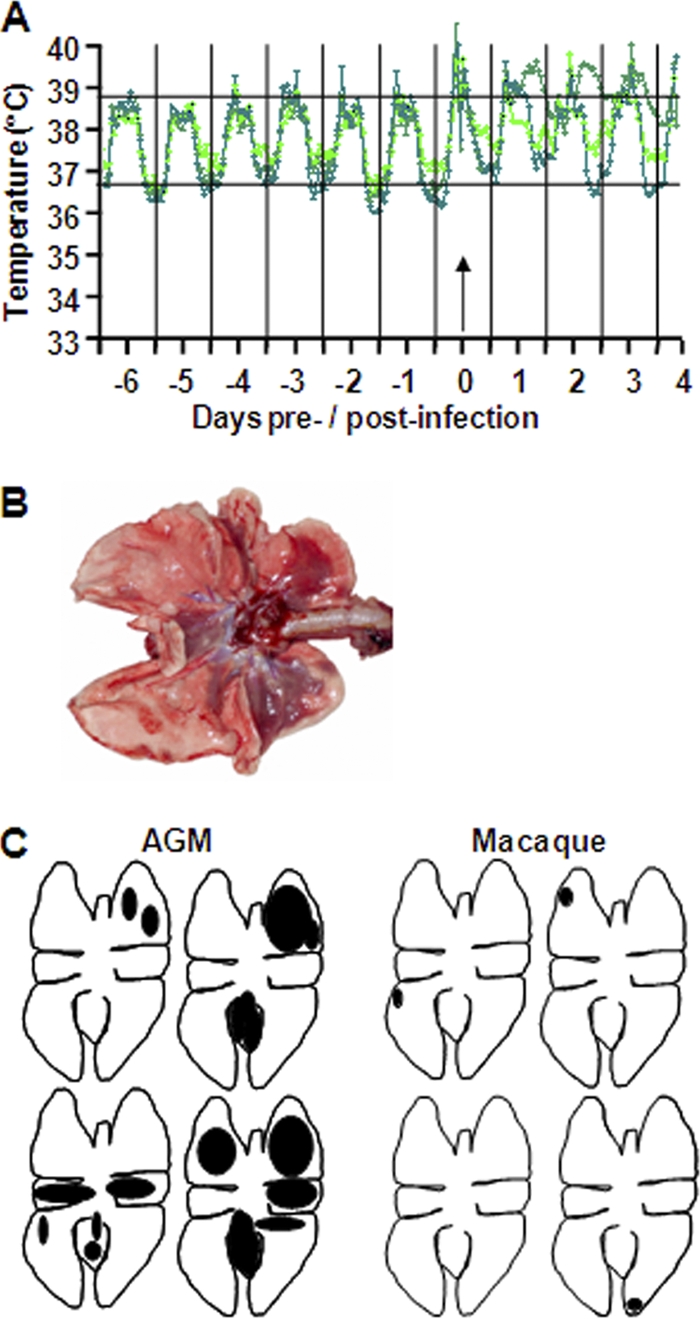
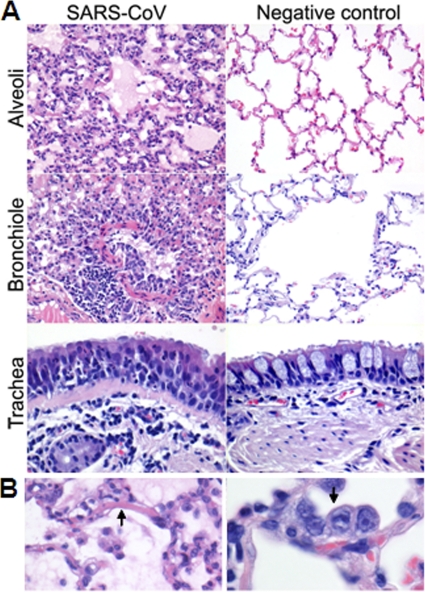
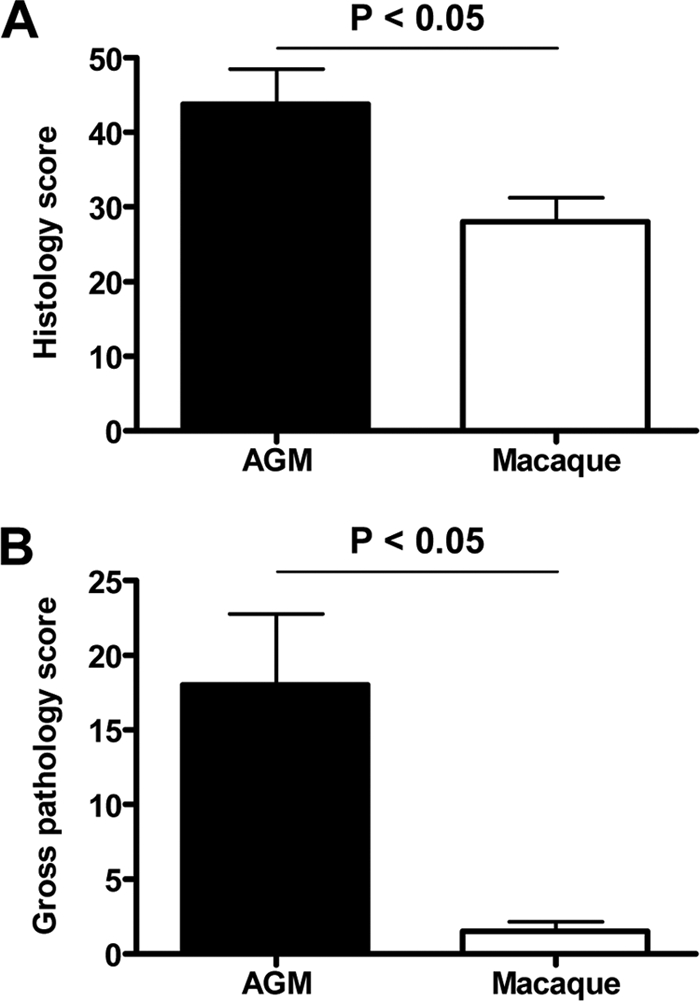
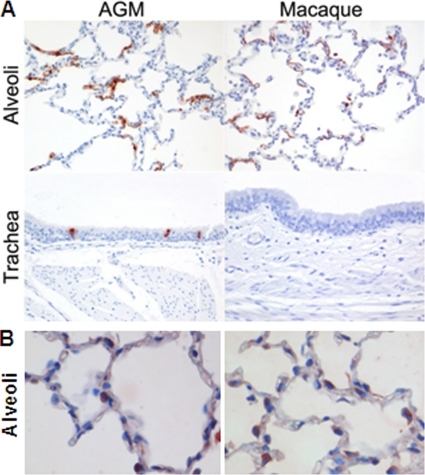
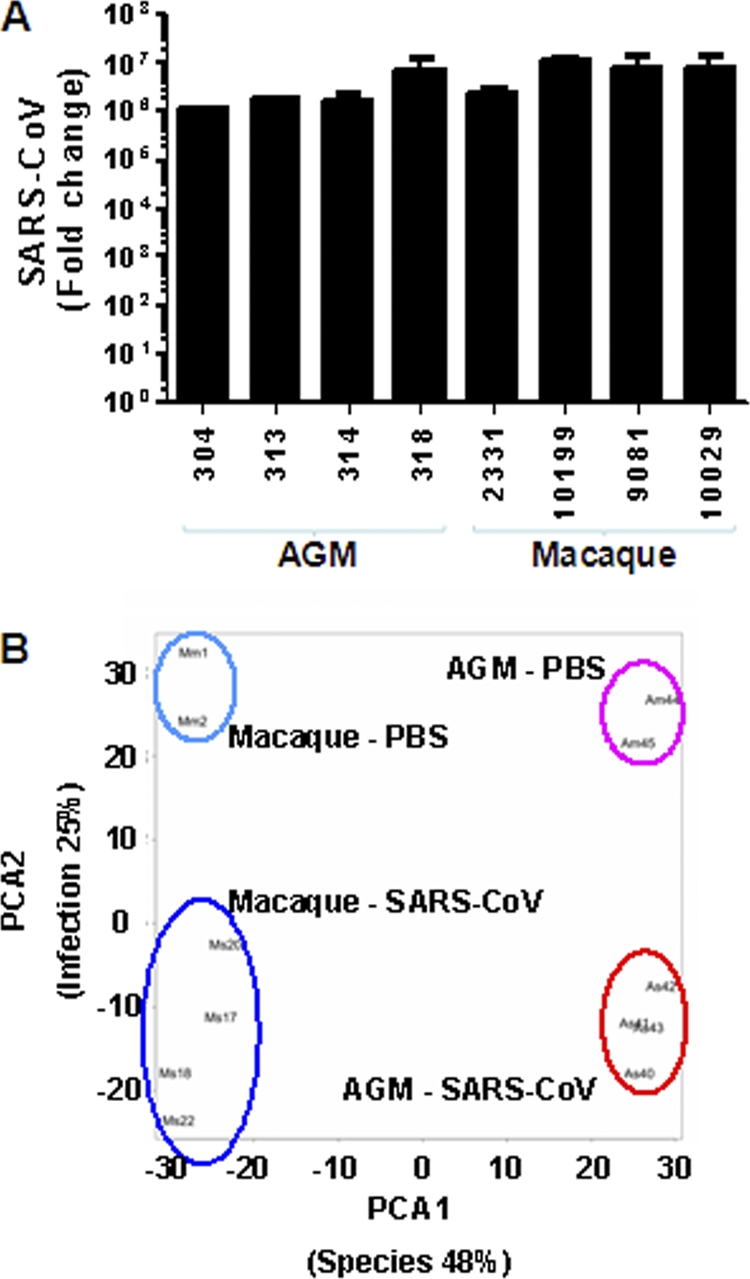
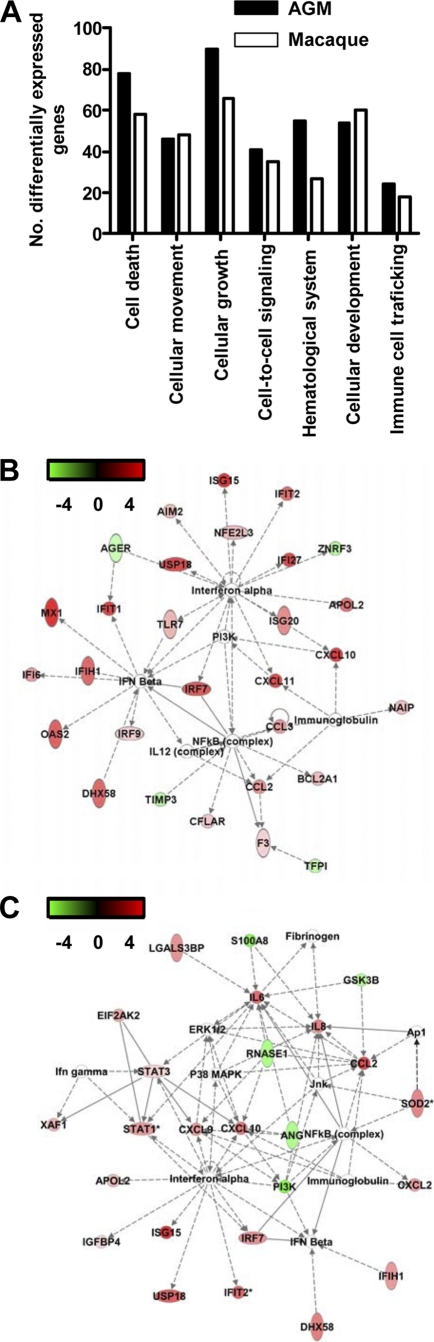
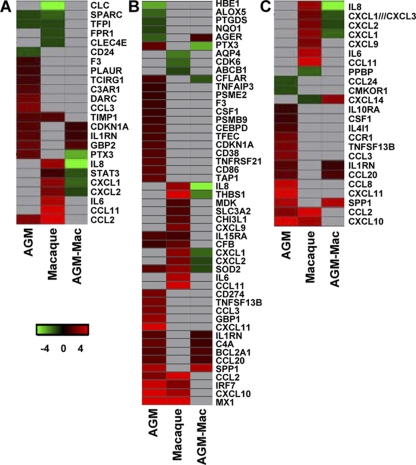
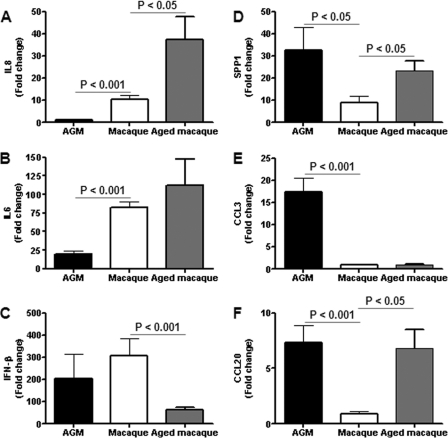
Acute lung injury (ALI) and acute respiratory distress syndrome (ARDS), caused by influenza A virus H5N1 and severe acute respiratory syndrome coronavirus (SARS-CoV), supposedly depend on activation of the oxidative-stress machinery that is coupled with innate immunity, resulting in a strong proinflammatory host response. Inflammatory cytokines, such as interleukin 1β (IL-1β), IL-8, and IL-6, play a major role in mediating and amplifying ALI/ARDS by stimulating chemotaxis and activation of neutrophils. To obtain further insight into the pathogenesis of SARS-CoV-associated ALI, we compared SARS-CoV infections in two different nonhuman primate species, cynomolgus macaques and African green monkeys. Viral titers in the upper and lower respiratory tract were not significantly different in SARS-CoV-infected macaques and African green monkeys. Inflammatory cytokines that play a major role in mediating and amplifying ALI/ARDS or have neutrophil chemoattractant activity, such as IL-6, IL-8, CXCL1, and CXCL2, were, however, induced only in macaques. In contrast, other proinflammatory cytokines and chemokines, including osteopontin and CCL3, were upregulated in the lungs of African green monkeys to a significantly greater extent than in macaques. Because African green monkeys developed more severe ALI than macaques, with hyaline membrane formation, some of these differentially expressed proinflammatory genes may be critically involved in development of the observed pathological changes. Induction of distinct proinflammatory genes after SARS-CoV infection in different nonhuman primate species needs to be taken into account when analyzing outcomes of intervention strategies in these species.


Figures

Fig. 1.
Fig. 1.
African green monkeys are more prone to develop SARS-CoV-associated disease than young adult macaques. (A) Fluctuations in body temperatures measured by transponders in the peritoneal cavity in three out of four SARS-CoV-infected African green monkeys. Temperatures are shown from day 6 prior to infection until 4 days postinfection. The arrow indicates day zero, when the animals were infected. The black horizontal lines mark the average range of temperature fluctuations prior to infection. (B) Macroscopic appearance of lung tissue of SARS-CoV-infected African green monkeys at day 4 postinfection, with dark-red consolidation. (C) Schematic diagrams of the lungs showing gross pathology lesions of SARS-CoV-infected young adult African green monkeys (AGM) and macaques.
Fig. 2.
Fig. 2.
Histological analyses of lungs from SARS-CoV-infected African green monkeys. (A) Alveoli of PBS-infected (right) and SARS-CoV-infected (left) African green monkeys showing diffuse alveolar damage, characterized by distension of alveolar walls with influx of inflammatory cells, necrosis, type II pneumocyte hyperplasia, intra-alveolar edema, and hyaline membrane formation. The bronchioles of PBS-infected (right) and SARS-CoV-infected (left) African green monkeys show infiltration of inflammatory cells, intraluminal edema fluid, and hypertrophy and hyperplasia of bronchiolar epithelium. The tracheas of PBS-infected (right) and SARS-CoV-infected (left) African green monkeys show multifocal lymphoplasmacytic tracheobronchoadenitis with infiltration of inflammatory cells surrounding the bronchial seromucous glands. (B) Lesions of SARS-CoV-infected African green monkeys are shown in more detail, with hyaline membrane formation (left) and type II pneumocyte hyperplasia (right). The sections were stained with H&E. Original magnifications, ×20 and ×40.
Fig. 3.
Fig. 3.
African green monkeys display more severe pathology than macaques. (A) Histology scores of the lungs of African green monkey (AGM) and macaque groups were determined and averaged (plus SEM). (B) Gross pathology scores of AGM and macaque groups were determined by visual inspection of the lungs during necropsy and averaged (plus SEM).
Fig. 4.
Fig. 4.
Viral replication levels in the respiratory tracts of SARS-CoV-infected African green monkeys and macaques. (A and B) SARS-CoV replication in the throats (A) and noses (B) of SARS-CoV-infected African green monkeys (black bars) and macaques (white bars) at days 2 and 4 postinfection as determined by real-time RT-PCR. Viral-RNA levels are displayed as TCID50 equivalents (eq.)/ml swab medium (plus SEM). (C) Average fold change in SARS-CoV mRNA levels (plus SEM) in the lungs of African green monkeys and macaques compared to PBS-infected animals as determined by real-time RT-PCR and depicted on a log scale. In addition, SARS-CoV titration of lung homogenates is shown in TCID50 per gram lung tissue. (D) Quantitative assessment of SARS-CoV-infected cells in the lungs of African green monkeys and macaques depicted as a percentage of SARS-CoV-positive fields (plus SEM).
Fig. 5.
Fig. 5.
Lungs of African green monkeys and cynomolgus macaques showing SARS-CoV (A) and ACE2 (B) antigen expression in the alveoli and/or trachea from SARS-CoV and PBS-infected animals, respectively. Sections were stained with immunoperoxidase and counterstained with hematoxylin. Original magnifications, ×20.
Fig. 6.
Fig. 6.
Global gene expression profiles of individual African green monkeys and macaques. (A) Average fold change in SARS-CoV mRNA levels (plus SEM) in the lungs of African green monkeys and macaques compared to PBS-infected animals as determined by real-time RT-PCR and depicted on a log scale. (B) PCA of transcriptional-profiling data. Each combination of letters and numbers (Am44, Am45, Mm1, Mm2, Am40, Am41, Am42, Am43, Mm17, Mm18, Mm20, and Mm22) represents an individual PBS- or SARS-CoV-infected animal plotted in two dimensions using their projections onto the first two principal components, species and infection. The colored ovals represent the groups of PBS-infected and SARS-CoV-infected African green monkeys and macaques. The first two principal components account for 48% and 25% of variation in the data, respectively.
Fig. 7.
Fig. 7.
Innate host response to SARS-CoV infection in African green monkeys. (A) Numbers of differentially expressed genes in African green monkeys and macaques with functions in, for example, cellular growth and proliferation, cell movement, cell death, or cell-to-cell signaling and interaction obtained from the Ingenuity Pathways Knowledge Base compared to those in their respective PBS-infected animals. (B) African green monkeys present a “top” network, with genes involved in the antiviral response and proinflammatory response. A network is a group of biologically related genes that is derived from known relationships present in the Ingenuity Pathways Knowledge Base. The diagram represents the interactions, both direct (solid lines) and indirect (dashed lines), between differentially expressed genes and gene products identified on day 4 postinfection in African green monkeys. Red indicates upregulated genes, whereas downregulated genes are depicted in green. (C) Macaques also present a “top” network, with genes involved in the antiviral response and proinflammatory response. The diagram represents the interactions, both direct (solid lines) and indirect (dashed lines), between differentially expressed genes and gene products identified on day 4 postinfection in macaques. Red indicates upregulated genes, whereas downregulated genes are depicted in green.
Fig. 8.
Fig. 8.
Innate host responses to SARS-CoV infection in African green monkeys and macaques. (A to C) Gene expression profiles showing differentially expressed genes involved in development of ARDS (A), NF-κB target genes (B), and cytokine/chemokine genes (C) of African green monkeys and macaques compared to their PBS controls and from the direct contrast of SARS-CoV-infected African green monkeys and macaques (AGM-Mac). Gene sets were obtained from the Ingenuity Pathways Knowledge Base and were changed ≥2-fold (absolute) in at least one of the African green monkey or macaque groups compared to their respective PBS-infected controls. The data presented are error-weighted fold change averages for four animals per group. The genes shown in red were upregulated, those in green were downregulated, and those in gray were not significantly differentially expressed in infected animals relative to PBS-infected animals (log [base 2]-transformed expression values; the minimum and maximum values of the color range were −4 and 4). The gene accession numbers are available in Table S1 in the supplemental material.
Fig. 9.
Fig. 9.
Quantitative RT-PCR confirmation of cytokine/chemokine mRNA levels. Quantitative RT-PCR for IL-8 (A), IL-6 (B), IFN-β (C), SPP1 (D), CCL3 (E), and CCL20 (F) was performed on one to three separate lung samples per animal with substantial virus replication. The data presented are error-weighted (plus SEM) averages of the fold change in SARS-CoV-infected African green monkeys and macaques compared to their respective PBS-infected controls.
Fig. 10.
Fig. 10.
Osteopontin expression in macrophages in SARS-CoV-infected African green monkeys. The same lung sections of SARS-CoV-infected African green monkeys were stained for expression of osteopontin (A) or CD68 (B), a marker for macrophages. The sections were stained with immunoperoxidase and counterstained with hematoxylin. Original magnifications, ×20.

References

    1. Benjamini Y., Hochberg Y. 1995. Controlling the false discovery rate: a practical and powerful approach to multiple testing. J. R. Soc. B 57:289–300
    1. Berman J. S., et al. 2004. Altered bleomycin-induced lung fibrosis in osteopontin-deficient mice. Am. J. Physiol. Lung Cell. Mol. Physiol. 286:L1311–L1318 - PubMed
    1. Cameron M. J., et al. 2007. Interferon-mediated immunopathological events are associated with atypical innate and adaptive immune responses in patients with severe acute respiratory syndrome. J. Virol. 81:8692–8706 - PMC - PubMed
    1. Chabas D., et al. 2001. The influence of the proinflammatory cytokine, osteopontin, on autoimmune demyelinating disease. Science 294:1731–1735 - PubMed
    1. Chen M., et al. 2009. Regulatory effects of IFN-beta on production of osteopontin and IL-17 by CD4+ T cells in MS. Eur. J. Immunol. 39:2525–2536 - PubMed

Publication types

MeSH terms