. 2011 Feb 16;31(7):2361-70.
doi: 10.1523/JNEUROSCI.5764-10.2011.

Inhibition of the plasma membrane Ca2+ pump by CD44 receptor activation of tyrosine kinases increases the action potential afterhyperpolarization in sensory neurons

Affiliations

Inhibition of the plasma membrane Ca2+ pump by CD44 receptor activation of tyrosine kinases increases the action potential afterhyperpolarization in sensory neurons

Biswarup Ghosh et al. J Neurosci. .

Abstract

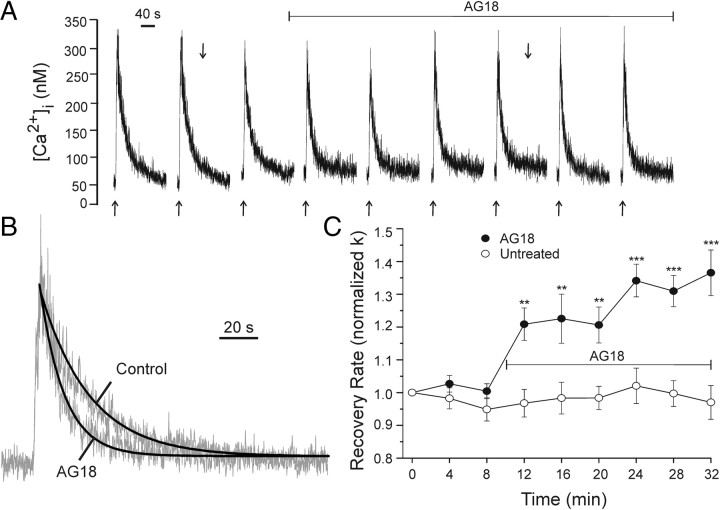
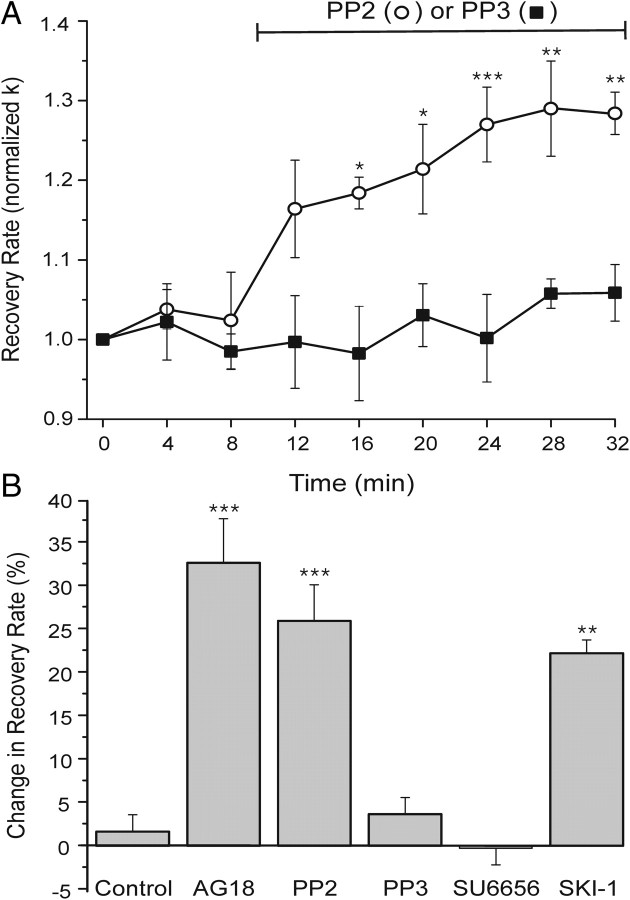
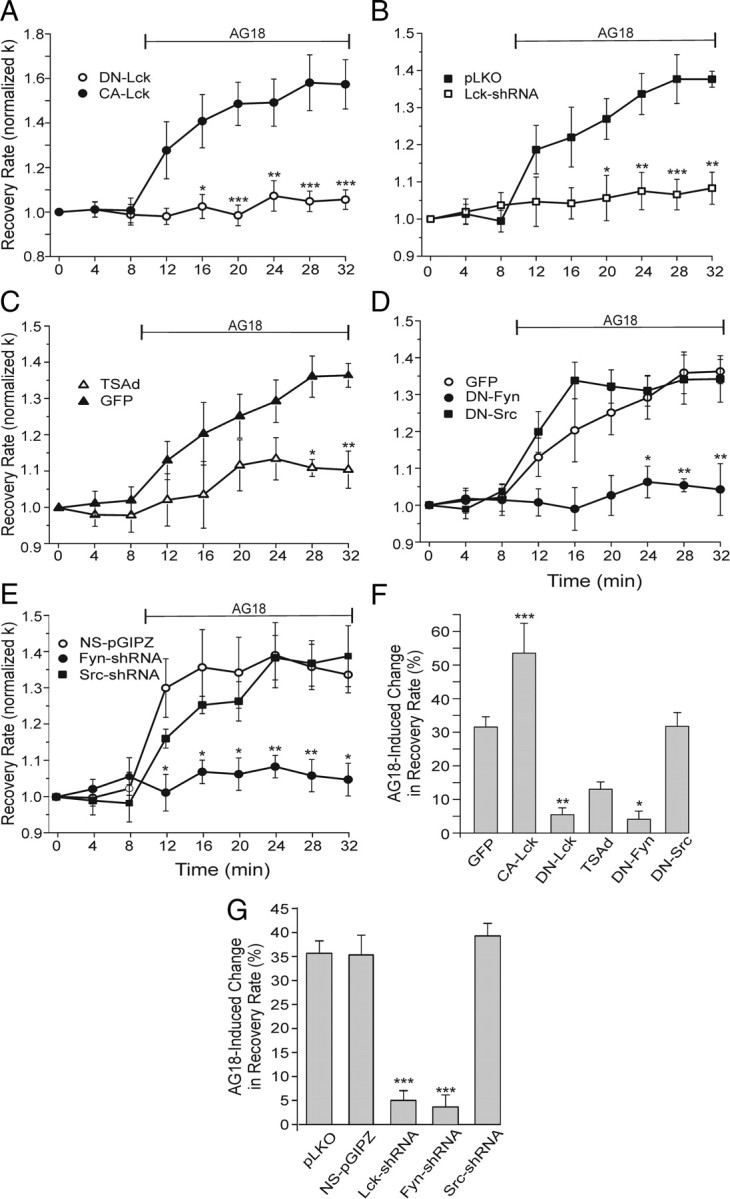
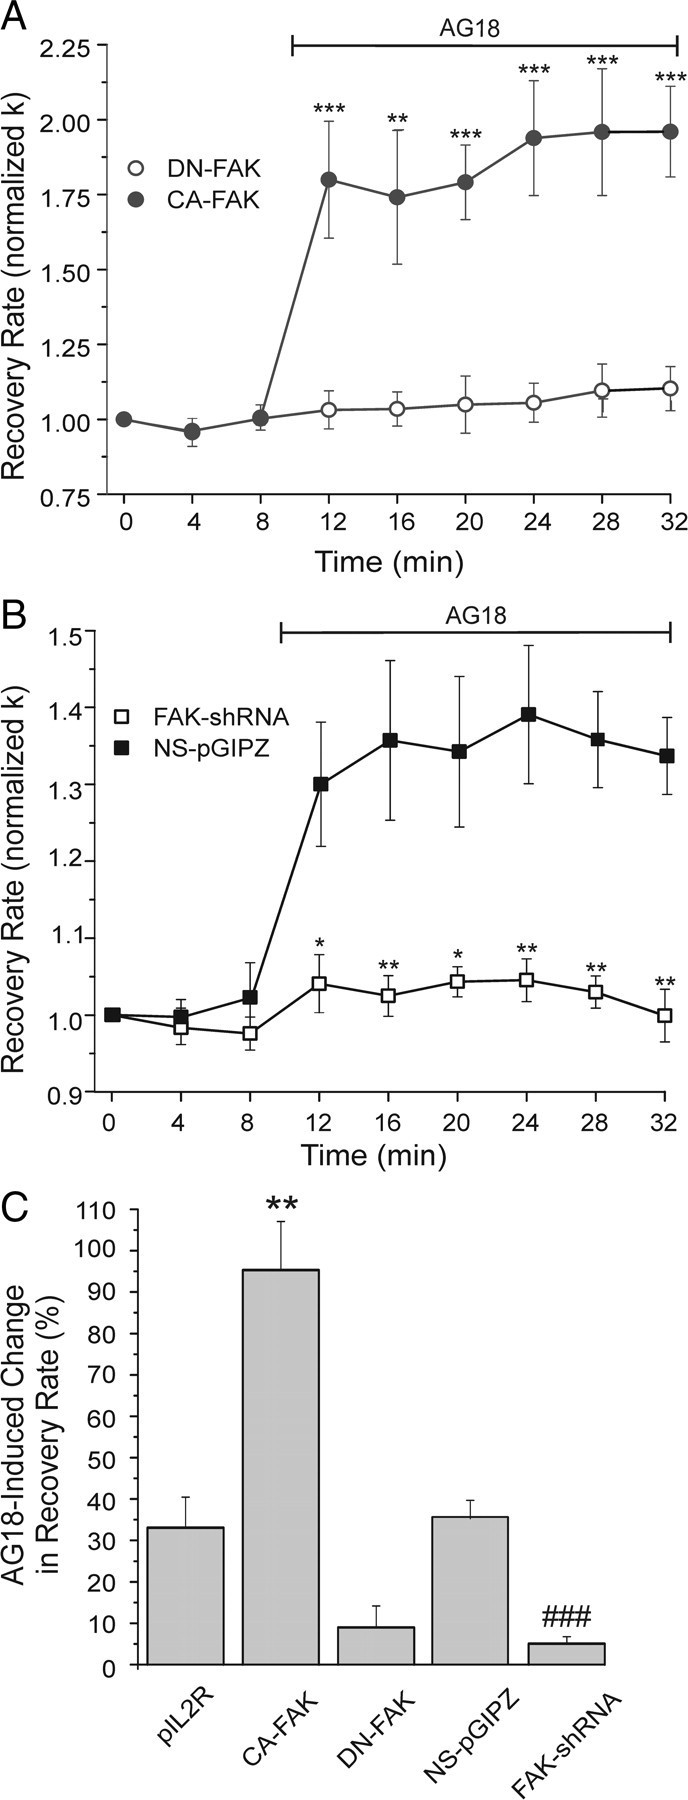
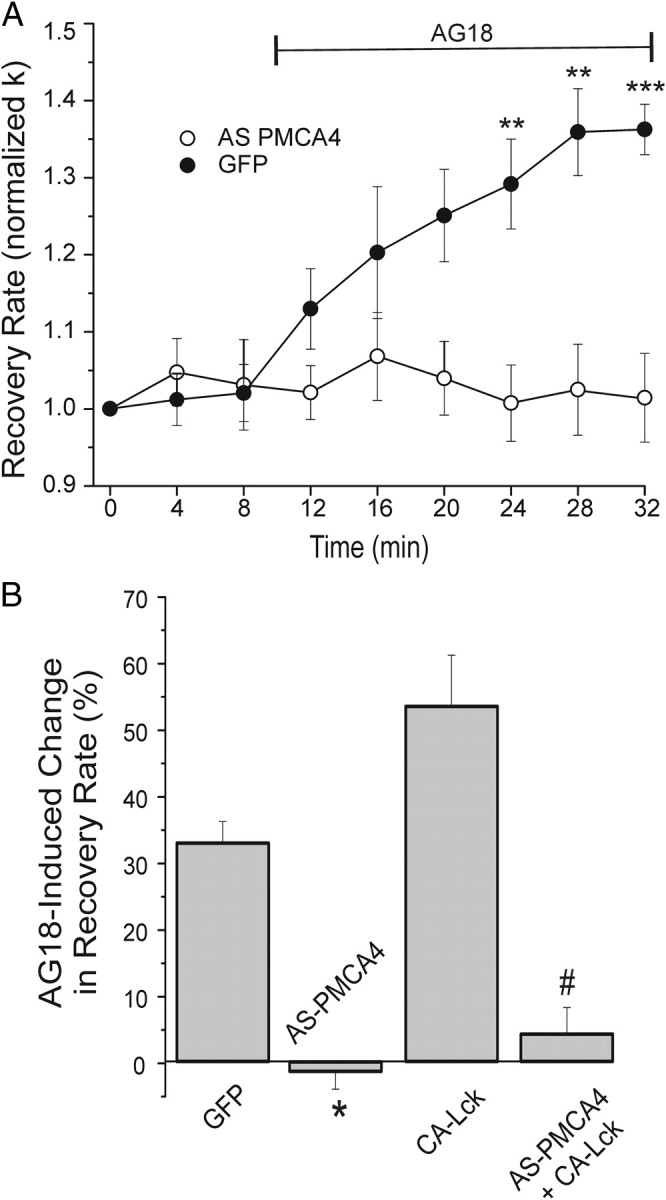
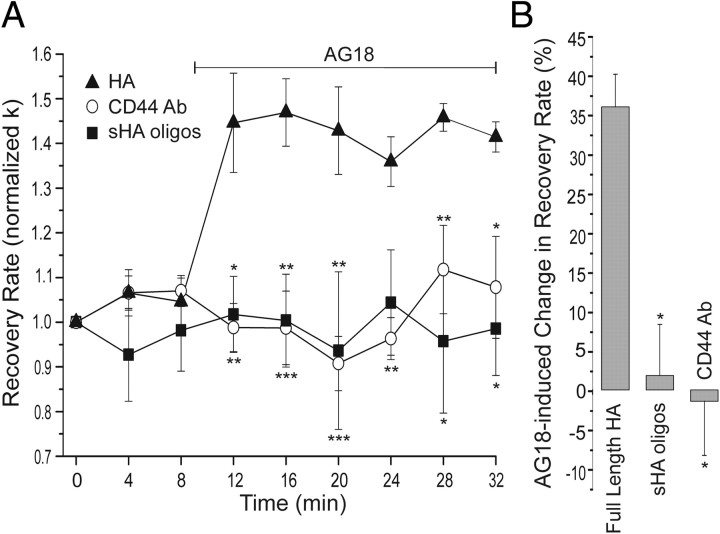
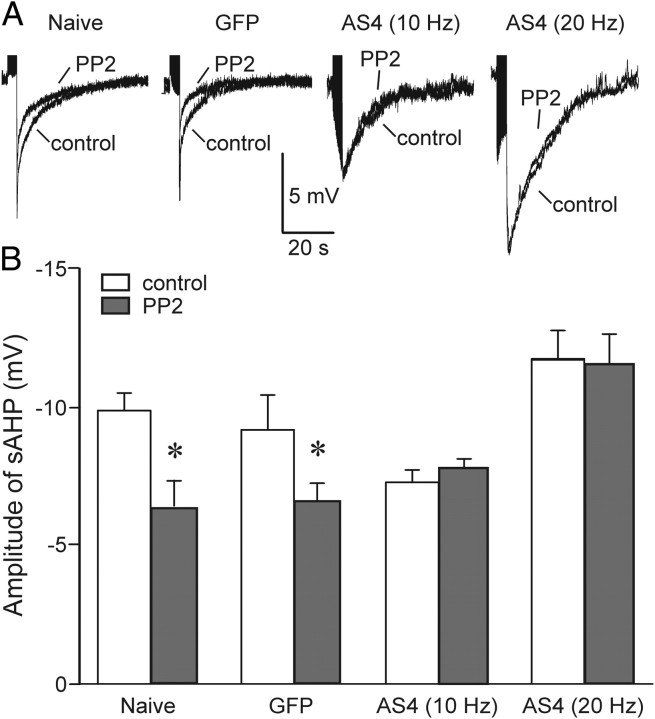
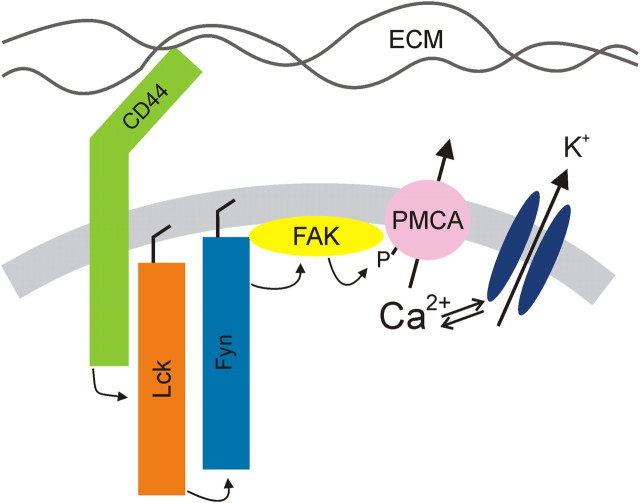
The cytoplasmic Ca(2+) clearance rate affects neuronal excitability, plasticity, and synaptic transmission. Here, we examined the modulation of the plasma membrane Ca(2+) ATPase (PMCA) by tyrosine kinases. In rat sensory neurons grown in culture, the PMCA was under tonic inhibition by a member of the Src family of tyrosine kinases (SFKs). Ca(2+) clearance accelerated in the presence of selective tyrosine kinase inhibitors. Tonic inhibition of the PMCA was attenuated in cells expressing a dominant-negative construct or shRNA directed to message for the SFKs Lck or Fyn, but not Src. SFKs did not appear to phosphorylate the PMCA directly but instead activated focal adhesion kinase (FAK). Expression of constitutively active FAK enhanced and dominant-negative or shRNA knockdown of FAK attenuated tonic inhibition. Antisense knockdown of PMCA isoform 4 removed tonic inhibition of Ca(2+) clearance, indicating that FAK acts on PMCA4. The hyaluronan receptor CD44 activates SFK-FAK signaling cascades and is expressed in sensory neurons. Treating neurons with a CD44-blocking antibody or short hyaluronan oligosaccharides, which are produced during injury and displace macromolecular hyaluronan from CD44, attenuated tonic PMCA inhibition. Ca(2+)-activated K(+) channels mediate a slow afterhyperpolarization in sensory neurons that was inhibited by tyrosine kinase inhibitors and enhanced by knockdown of PMCA4. Thus, we describe a novel kinase cascade in sensory neurons that enables the extracellular matrix to alter Ca(2+) signals by modulating PMCA-mediated Ca(2+) clearance. This signaling pathway may influence the excitability of sensory neurons following injury.


Figures

Figure 1.
Figure 1.
Broad-spectrum PTK inhibitor AG18 accelerates Ca2+ clearance. A, Representative traces show action potential-induced [Ca2+]i transients recorded using indo-1-based microfluorimetry as described in Materials and Methods. Extracellular field stimulation (4 s, 5 Hz) was applied at the times indicated (↑). The recording was performed in the presence of 10 μm cyclopiazonic acid. One hundred micromolar AG18 was applied by superfusion at the time indicated by the horizontal bar. B, The recovery phases of the responses indicated in A (↓) were normalized to peak and fitted with an exponential curve (heavy line). C, Plot summarizes changes in [Ca2+]i recovery kinetics (normalized k) for untreated cells (open circles, n = 5) and cells treated with AGI8 (solid circles, n = 5) at the time indicated by the horizontal bar. Data are mean ± SE. **p < 0.01, ***p < 0.001 relative to untreated, repeated-measures ANOVA with Bonferroni post hoc test.
Figure 2.
Figure 2.
Selective PTK inhibitors suggest that a Src family kinase inhibits PMCA in DRG neurons. A, Plot summarizes changes in [Ca2+]i recovery kinetics (normalized k) for cells treated with the Src family tyrosine kinase inhibitor PP2 (10 μm; open circles, n = 5) or its inactive analog PP3 (10 μm; solid squares, n = 5). Drug was present during the time indicated by the horizontal bar. Data are mean ± SE. *p < 0.05, **p < 0.01, ***p < 0.001 relative to PP3, repeated-measures ANOVA with Bonferroni post hoc test. B, Bar graph summarizes percentage change in recovery rate for untreated cells (control) (from Fig. 1C), or cells treated with 100 μm AG18 (AG18) (from Fig. 1A–C) (n = 5), 10 μm PP2 (n = 5), 10 μm PP3 (n = 5), 10 μm SU6656 (n = 5), or 10 μm SKI-1 (n = 4). Percentage change in recovery rate = 100[(kdrugkcontrol)/kcontrol], where kcontrol is the mean of the three k values determined before drug application (t = 0, 4, and 8 min) and kdrug is the mean of the last three k values following drug application (t = 24, 28, and 32 min). Initial rate constants (k) for the cells before their respective treatments were 4.1 ± 0.5, 3.9 ± 0.6, 4.1 ± 0.2, 4.4 ± 0.3, 6.3 ± 0.7, and 6 ± 1 min−1. **p < 0.01, ***p < 0.001 relative to control, ANOVA with Bonferroni post hoc test.
Figure 3.
Figure 3.
Lck and Fyn activity slow Ca2+ pump kinetics. A–E, Plots summarize changes in [Ca2+]i recovery kinetics (normalized k) for cells expressing the indicated constructs. AG18 (100 μm) was added at the time indicated by the horizontal bar. Significance was determined using repeated-measures ANOVA with Bonferroni post hoc test. A, Plot summarizes normalized k values for cells expressing DN-Lck (open circles; n = 5) or CA-Lck (closed circles; n = 7). *p < 0.05, **p < 0.01, ***p < 0.001 relative to CA-Lck. B, Plot of Ca2+ clearance rate (k) for control (pLKO empty vector; n = 4) and Lck-shRNA cells (n = 8). Before AG18 application, k values were 4.8 ± 0.6 and 4.5 ± 0.6 min−1, respectively. *p < 0.05, **p < 0.01, ***p < 0.001 relative to pLKO. C, Plot of Ca2+ clearance rate (k) for control (n = 7) and Tsad-expressing (n = 6) cells. Before AG18 application, k values were 3.1 ± 0.3 and 4.4 ± 0.4 min−1, respectively. *p < 0.05, **p < 0.01 relative to GFP. D, Plot of Ca2+ clearance rate (k) for cells expressing GFP (open circles; n = 7), DN-Fyn (solid circles; n = 3), or DN-Src (solid squares; n = 4). Before AG18 application, k values were 3.1 ± 0.3, 2.4 ± 0.5, and 3.1 ± 0.7 min−1, respectively. *p < 0.05, **p < 0.01 relative to GFP. E, Plot of Ca2+ clearance rate (k) for cells expressing nonsilencing shRNA (NS-pGIPZ; open circles; n = 6), Fyn-shRNA (solid circles n = 4), or Src-shRNA (solid squares; n = 5). Before AG18 application, k values were 3.6 ± 0.9, 3.6 ± 0.9, and 3.4 ± 0.6 min−1, respectively. *p < 0.05, **p < 0.01 relative to NS-pGIPZ. F, G, Bar graphs summarize the percentage change in Ca2+ clearance kinetics (k) induced by 100 μm AG18 in DRG neurons expressing GFP (n = 7), CA-Lck (n = 7), DN-Lck (n = 5), TSAd (n = 6), DN-Fyn (n = 3), DN-Src (n = 4), pLKO (n = 4), NS-pGIPZ (n = 6), Lck-shRNA (n = 8), Fyn-shRNA (n = 4), or Src-shRNA (n = 5). Percentage change in recovery rate = 100[(kAG18kcontrol)/kcontrol)], where kcontrol is the mean of the three rate constants determined before drug application (t = 0, 4, and 8 min) and kAG18 is the mean of the last three rate constants following application of AG18 (t = 24, 28, and 32 min).*p < 0.05, **p < 0.01, ***p < 0.001 relative to GFP (F) or relative to NS-pGIPZ (G), ANOVA with Bonferroni post hoc test.
Figure 4.
Figure 4.
FAK inhibits Ca2+ pump kinetics. A, Plot summarizes [Ca2+]i recovery kinetics (normalized k) for cells expressing DN-FAK (open circles; n = 5) or CA-FAK (closed circles; n = 6). AG18 (100 μm) was added at the time indicated by the horizontal bar. **p < 0.01, ***p < 0.001 relative to DN-FAK, repeated-measures ANOVA with Bonferroni post hoc test. B, Plot of Ca2+ clearance rate (normalized k) for cells expressing nonsilencing shRNA (NS-pGIPZ; solid squares; n = 6) or FAK shRNA (open squares; n = 4). Before AG18 application, k values were 3.6 ± 0.9 and 3.9 ± 0.8 min−1, respectively. *p < 0.05, **p < 0.01 relative to NS-pGIPZ, repeated-measures ANOVA with Bonferroni post hoc test. C, Bar graph summarizes the percentage change in Ca2+ clearance kinetics (k) induced by 100 μm AG18 in DRG neurons expressing pIL2R (n = 4), CA-FAK (n = 6), DN-FAK (n = 5), NS-pGIPZ (n = 6), or FAK-shRNA (n = 4). Percentage change in recovery rate = 100[(kAG18kcontrol)/kcontrol)], where kcontrol is the mean of the three rate constants determined before drug application (t = 0, 4, and 8 min) and kAG18 is the mean of the last three rate constants following application of AG18 (t = 24, 28, and 32 min).**p < 0.01 relative to pIL2R, ANOVA with Bonferroni post hoc test. ###p < 0.001 relative to NS-pGIPZ, Student's t test.
Figure 5.
Figure 5.
Knockdown of PMCA4 prevents PTK modulation of Ca2+ clearance. A, Plot summarizes changes in [Ca2+]i recovery kinetics (normalized k) for cells expressing AS-PMCA4 (open circles; n = 7) or GFP (closed circles; n = 6). AG18 (100 μm) was added at the time indicated by the horizontal bar. Data plotted are mean ± SE. **p < 0.01, ***p < 0.001 relative to GFP, repeated-measures ANOVA with Bonferroni post hoc test. B, Bar graph summarizes the percentage change in Ca2+ clearance kinetics (k) induced by 100 μm AG18 in DRG neurons expressing GFP (n = 7), AS-PMCA4 (n = 6), CA-Lck (n = 7), or AS-PMCA4 + CA-Lck (n = 5). Before AG18 application, k values were 3.1 ± 0.3, 3.8 ± 0.5, 2.6 ± 0.3, and 3.5 ± 0.5 min−1, respectively. Percentage change in recovery rate = 100[(kAG18kcontrol)/kcontrol)], where kcontrol is the mean of the three rate constants determined before drug application (t = 0, 4, and 8 min) and kAG18 is the mean of the last three rate constants following application of AG18 (t = 24, 28, and 32 min). *p < 0.05 relative to GFP; #p < 0.05 relative to CA-Lck, Student's t test.
Figure 6.
Figure 6.
CD44 activates PTK-dependent inhibition of PMCA4. A, Plot summarizes changes in [Ca2+]i recovery kinetics (normalized k) for cells treated for 24 h with 5 μg/ml CD44-blocking antibody (open circles; n = 5), 40 μg/ml sHA-oligos (filled squares; n = 3), or 40 μg/ml full-length HA (filled triangles; n = 3). Before AG18 application, k values were 8 ± 2, 2.9 ± 0.7, and 5 ± 1 min−1, respectively. AG18 (100 μm) was added at the time indicated by the horizontal bar. Data are mean ± SE. *p < 0.05, **p < 0.01, ***p < 0.001 relative to full-length HA, repeated-measures ANOVA with Bonferroni post hoc test. B, Bar graph summarizes the percentage change in Ca2+ clearance kinetics (k) induced by 100 μm AG18 in DRG neurons treated for 24 h with CD44-blocking antibody (CD44 Ab; n = 5), high-molecular-weight HA (full-length HA; n = 3), and sHA-oligos (n = 3). Percentage change in recovery rate = 100[(kAG18kcontrol)/kcontrol)], where kcontrol is the mean of the three rate constants determined before drug application (t = 0, 4, and 8 min) and kAG18 is the mean of the last three rate constants following application of AG18 (t = 24, 28, and 32 min). *p < 0.05 relative to full-length HA, ANOVA with Bonferroni post hoc test.
Figure 7.
Figure 7.
PTKs alter Ca2+-activated K channels by regulating Ca2+ clearance. DRG neurons were held at −65 mV in current clamp using the perforated patch technique as described in Materials and Methods. Bursts of action potentials (4 s trains) were evoked by injecting depolarizing current (0.1 ms pulses) every 2 min using a protocol similar to that used to elicit increases in [Ca2+]i to study Ca2+ clearance. The stimulus frequency was 50 Hz for naive and GFP-expressing cells and was reduced to 10 or 20 Hz for AS-PMCA4-expressing cells as indicated. A, Recordings show the mean of three sweeps recorded before (control) and 8 min after superfusion of 10 μm PP2. Action potentials were truncated to better display the AHP. Representative recordings are shown from a naive cell, a cell expressing GFP, and cells expressing AS-PMCA4 stimulated with 10 or 20 Hz as indicated. B, Bar graph displays mean amplitude of AHP before (open bar) and after application of PP2 (solid bars) recorded from naive (n = 5) and GFP- (n = 5) and AS-PMCA4- (10 Hz n = 4; 20 Hz n = 5) expressing cells. Stimulus frequency is indicated in parentheses. *p < 0.05 relative to control, paired Student's t test.
Figure 8.
Figure 8.
Schematic diagram of proposed CD44-regulated signaling pathway.

Similar articles

Cited by

References

    1. Bain J, Plater L, Elliott M, Shpiro N, Hastie CJ, McLauchlan H, Klevernic I, Arthur JS, Alessi DR, Cohen P. The selectivity of protein kinase inhibitors: a further update. Biochem J. 2007;408:297–315. - PMC - PubMed
    1. Blake RA, Broome MA, Liu X, Wu J, Gishizky M, Sun L, Courtneidge SA. SU6656, a selective src family kinase inhibitor, used to probe growth factor signaling. Mol Cell Biol. 2000;20:9018–9027. - PMC - PubMed
    1. Bozulic LD, Malik MT, Dean WL. Effects of plasma membrane Ca(2+) -ATPase tyrosine phosphorylation on human platelet function. J Thromb Haemost. 2007;5:1041–1046. - PubMed
    1. Burette A, Rockwood JM, Strehler EE, Weinberg RJ. Isoform-specific distribution of the plasma membrane Ca2+ ATPase in the rat brain. J Comp Neurol. 2003;467:464–476. - PubMed
    1. Cabodi S, Di Stefano P, Leal Mdel P, Tinnirello A, Bisaro B, Morello V, Damiano L, Aramu S, Repetto D, Tornillo G, Defilippi P. Integrins and signal transduction. Adv Exp Med Biol. 2010;674:43–54. - PubMed

Publication types

MeSH terms

LinkOut - more resources