. 2011 Feb 16;31(7):2447-60.
doi: 10.1523/JNEUROSCI.4433-10.2011.

WRP/srGAP3 facilitates the initiation of spine development by an inverse F-BAR domain, and its loss impairs long-term memory

Affiliations

WRP/srGAP3 facilitates the initiation of spine development by an inverse F-BAR domain, and its loss impairs long-term memory

Benjamin R Carlson et al. J Neurosci. .

Abstract

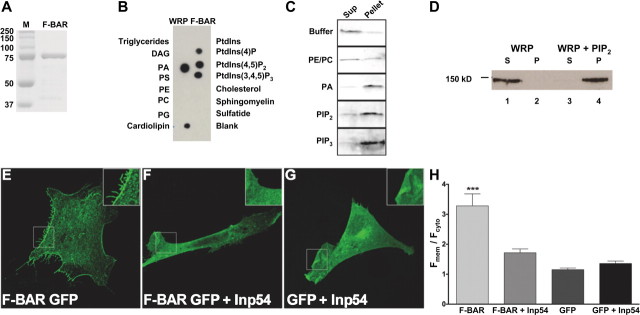
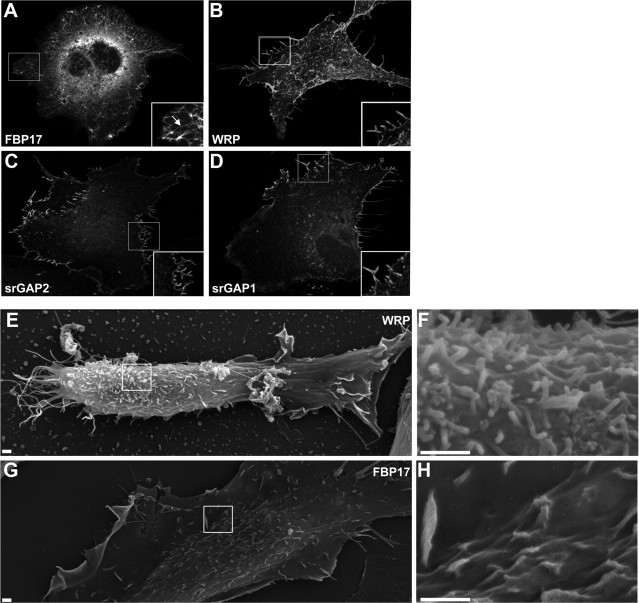
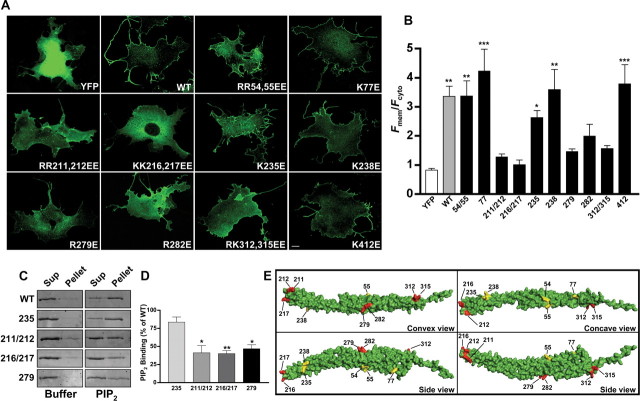
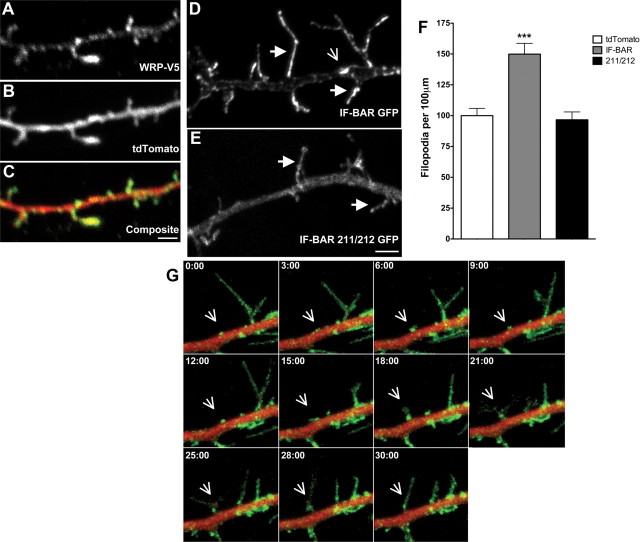
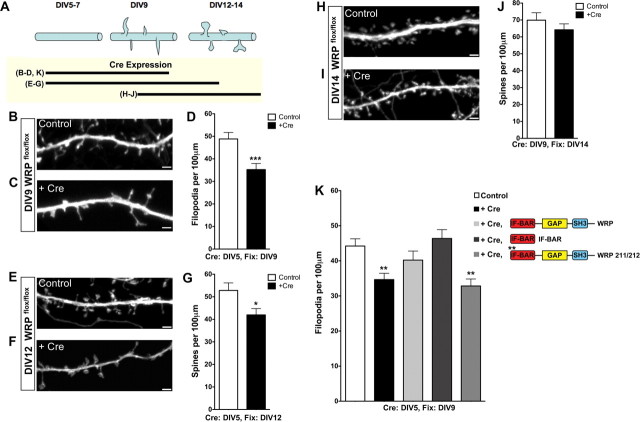
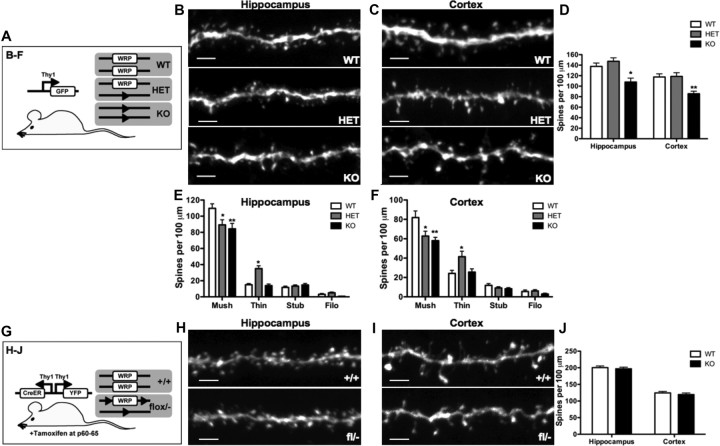
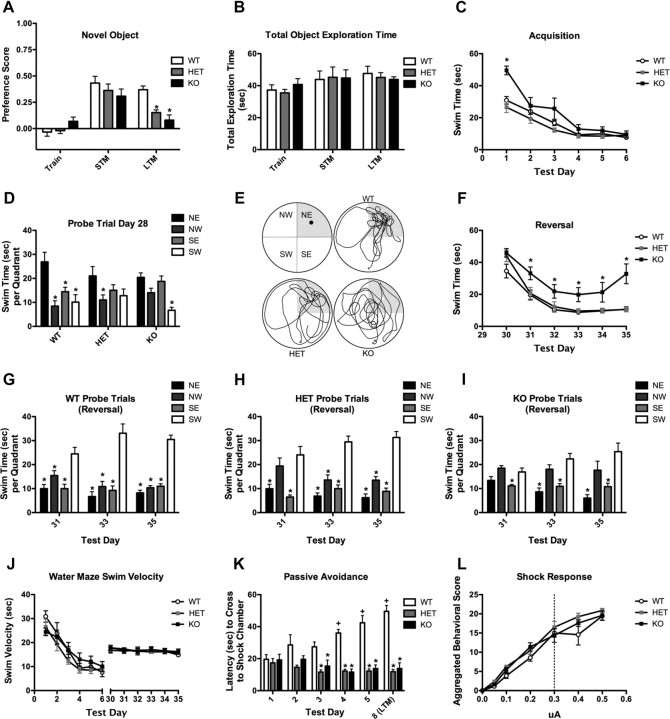
The WAVE-associated Rac GAP, WRP, is thought to regulate key aspects of synapse development and function and may be linked to mental retardation in humans. WRP contains a newly described inverse F-BAR (IF-BAR) domain of unknown function. Our studies show that this domain senses/facilitates outward protrusions analogous to filopodia and that the molecular basis for this is likely explained by a convex lipid-binding surface on the WRP IF-BAR domain. In dendrites the IF-BAR domain of WRP forms a bud on the shaft from which precursors to spines emerge. Loss of WRP in vivo and in vitro results in reduced density of spines. In vivo this is primarily a loss of mushroom-shaped spines. Developmentally, WRP function is critical at the onset of spinogenesis, when dendritic filopodia are prevalent. Finally, because WRP is implicated in mental retardation, behaviors of WRP heterozygous and null mice have been evaluated. Results from these studies confirm that loss of WRP is linked to impaired learning and memory.


Figures

Figure 1.
Figure 1.
Analysis of WRP F-BAR membrane lipid interactions. A, Image of Coomassie-stained SDS-PAGE gel showing molecular weight markers (M) and purified GST-F-BAR domain. B, Representative immunoblot analysis of purified WRP F-BAR domain incubated on a membrane lipid array to detect WRP F-BAR and lipid interactions. Each lipid on the array is labeled. PtdIns, Phosphatidylinositol; DAG, diacylglycerol; Sulfatide, 3-sulfogalactosylceramide. C, Liposome cosedimentation analysis of WRP F-BAR with PE/PC liposomes containing 10% PA, PIP2, or PIP3). Negative controls of buffer alone and PE/PC only are also shown. Protein is visualized using an in-gel fluorescent stain. Sup, Supernatant. D, Cosedimentation analysis of purified full-length WRP. WRP is soluble in buffer alone (lanes 1,2), but cosedimentates with PIP2 in the pellet (lanes 3,4). S, Supernatant, P, pellet. EG, Representative fluorescent images of Cos7 cells expressing F-BAR GFP (E), F-BAR GFP and the yeast PIP2 phosphatase Inp54 (F), or GFP alone and Inp54 (G). H, Graph depicting the ratio of fluorescence at the membrane (Fmem) to cytosolic fluorescence (Fcyt) localization of the F-BAR GFP in the presence or absence of coexpression with Inp54 or GFP with Inp54. Expression of Inp54 disrupts the membrane targeting of WRP F-BAR GFP. Data represent mean ± SEM, n = 10 for each point; ***p < 0.001, F-BAR GFP versus any other condition.
Figure 2.
Figure 2.
F-BAR domains of the srGAP/WRP family facilitate outward protrusions of the cell membrane. AD, Cellular expression of several F-BAR domains in Cos7 cells. Fluorescent maximum projection images of Cos7 cell expressing FBP17-GFP (A), WRP F-BAR-GFP (B), srGAP2 F-BAR-GFP (C), or srGAP1 F-BAR-GFP (D). Boxed regions are depicted as inset images. Arrow in inset of A indicates tubulated membrane. EH, Representative scanning electron micrographs of cell expressing WRP F-BAR GFP (E, F) or GFP FBP17 (G, H). Boxed regions in E and G represent regions shown in F and H. Scale bars, 1 μm.
Figure 3.
Figure 3.
The WRP F-BAR membrane interaction interface maps to the presumed convex surface. A, Representative fluorescent images comparing the subcellular distribution of YFP, WT WRP F-BAR YFP, and several mutants of the WRP F-BAR domain. Identity of each mutant is indicated in the lower right quadrant of each panel. Scale bar, 10 μm. B, Graph comparing each construct against soluble YFP in cells using a ratio of fluorescence at the membrane (Fmem) to cytosolic fluorescence (Fcyt). Note that several mutants are not significantly different from soluble YFP. Data represents mean ± SEM; *p < 0.05, **p < 0.01, ***p < 0.001, YFP versus any other construct. C, D, Analysis of purified mutant WRP F-BAR domain interactions with PIP2 by cosedimentation assay. C, Representative images of fluorescently stained SDS-polyacrylamide gels showing the amounts of wild-type WRP F-BAR domain (WT), or those of four mutants (K235E, R211E/R212E, K216E/K217E, R279E) in the supernatant (Sup) or pellet fractions. The results of cosedimentation assays with either buffer alone or PIP2-containing liposomes are shown. D, Graph showing the quantitative analysis of three independent experiments for the amount of each mutant protein cosedimentating with PIP2 as a percentage of the wild-type F-BAR domain. Data represent mean ± SEM; *p < 0.05, **p < 0.01, WT versus any other protein. E, Structural model of the WRP F-BAR domain monomer based on alignments to FBP17. Each view of the structure is labeled in the lower right quadrant. Locations of amino acid residues screened by mutagenesis are labeled in each view. Positions that affected membrane targeting are colored red, whereas positions that did not affect subcellular localization are colored yellow.
Figure 4.
Figure 4.
Localization of the WRP IF-BAR domain to filopodia in neurons requires membrane binding. AC, Localization of WRP in dendritic filopodia in DIV9 cultured neurons. A, B, Fluorescent immunostaining of V5 epitope-tagged WRP (A) compared to the soluble fill tdTomato (B). C, Composite image showing the localization of WRP in filopodia and puncta along the shaft. D, Fluorescent image of WRP IF-BAR domain in DIV9 cultured neurons. Solid arrows indicate examples of dendritic filopodia showing an enrichment in fluorescent intensity. Open arrow is an example of a cluster of WRP along the shaft. E, Fluorescent image of WRP IF-BAR 211/212. Solid arrows indicate examples of dendritic filopodia, which do not show an enrichment in fluorescent intensity. F, Graph showing the quantitative analysis of dendritic protrusion density in neurons expressing tdTomato fluorescent protein alone or in combination with either WRP IF-BAR GFP or WRP IF-BAR 211/212 GFP. Data are expressed as the mean percentage of tdTomato protrusions ± SEM (%) from three independent experiments; ***p < 0.001, tdTomato versus IF-BAR GFP. G, Live imaging montage of WRP IF-BAR GFP versus soluble tdTomato. Open arrow indicates example cluster of WRP IF-BAR that form buds from which filopodia emerge. Time elapsed is indicated in the top left of each panel.
Figure 5.
Figure 5.
WRP is required during the onset of spinogenesis. A, Top, Schematic diagram representing the time course of spine development in postnatal hippocampal neuronal cultures. Bottom, Lines represent the different time courses of Cre recombinase expression in BJ to analyze the role of WRP during various developmental stages. Representative images of soluble tomato fluorescent protein (tdTomato) expression to visualize dendritic filopodia in control (B, E, H) versus tdTomato and GFP-Cre recombinase-transfected (C, F, I) WRPflox/flox neurons. Time point (DIV) at which imaging was performed is indicated at the left of each image. In B, C, E, F, the transfection of tdTomato and GFP-Cre was at DIV5 before onset of spinogenesis, whereas in H and I tdTomato and GFP-Cre were transfected at DIV9 after initiation of spinogenesis. D, G, J, Graphs depicting quantitative analysis of dendritic filopodial densities (D) and spine densities (G, J) from control (tdTomato only) versus tdTomato and GFP-Cre-expressing neurons. K, Rescue of filopodia density upon loss of WRP. Control wild-type neurons have a higher density of filopodia compared to knock-out neurons after Cre expression. The reduced filopodial density in the knock-out neurons is rescued by the expression of full-length WRP or the isolated IF-BAR domain. In contrast, expression of WRP that contains mutations in the IF-BAR domain does not rescue knock-out neurons. Legend for K is in the upper right, along with a schematic of the various conditions. Data represent mean ± SEM; *p < 0.05, ***p < 0.001, control versus Cre-expressing neurons. D: n = 30 control, n = 28 +Cre; G, n = 21 control, n = 21 +Cre; J: n = 21 control, n = 22 +Cre; K: n = 30 control, 30 +Cre, 32 +Cre and WRP, 30 +Cre and IF-BAR, 27 +Cre and WRP 211/212. Analysis of significance in K was by ANOVA and Dunnett's multiple comparison post hoc test; **p < 0.01, control versus each condition.
Figure 6.
Figure 6.
WRP regulates mushroom spine development but not maintenance in vivo. A, Schematic depicting the Thy-1 GFP transgene crossed into the WRP WT, heterozygous (HET), and knock-out (KO mice. B, C, Maximum image projections of confocal images from secondary dendrites in the CA1 hippocampal region (B) and secondary dendrites of layer IV/V of the cortex (C). Genotype is indicated in bottom right corner. Scale bars, 3 μm. D, Graph depicting quantitative analysis from mice of spine densities from secondary hippocampal dendrites of WRP WT (n = 22), HET (n = 19), and KO (n = 20) and cortical dendrites of WRP WT (n = 19), HET (n = 19), and KO (n = 18). KO mice have a 24% reduction in spine density in the hippocampus and 30% reduction in the cortex compared to WT and HET littermates. E, F, Graph depicting quantitative analysis from mice of spine morphology from secondary hippocampal dendrites of WRP WT (n = 10), HET (n = 15), and KO (n = 11) (E) and cortical dendrites of WRP WT (n = 11), HET (n = 13), and KO (n = 10) (F). HET and KO mice have a 18.7 and 23.1% reduction in density mushroom type spines in the hippocampus and a 23.3 and 29.1% reduction in the cortex compared to WT. Data represents mean ± SEM; *p < 0.05, **p < 0.01, WT versus KO. G, Schematic depicting the SLICKV transgene crossed into the WRP WT, and KO mice. Time of tamoxifen injections (i.e., P60–65) is indicated at the bottom. HJ, Maximum image projections of confocal images from secondary dendrites in the CA1 hippocampal region (H) and secondary dendrites of layer IV/V of the cortex (I). WRP genotype is indicated in bottom right corner. Scale bars, 3μm. J, Graph depicting quantitative analysis of spine densities of secondary hippocampal dendrites of WRP WT (n = 20) and KO (n = 21) and cortical dendrites of WRP WT (n = 20) and KO (n = 20).
Figure 7.
Figure 7.
WRP heterozygous and knock-out mice are impaired in multiple learning and memory tests. A, Analysis of WRP WT, WRP heterozygous (HET), and WRP knock-out (KO) mice response in the novel object recognition test, n = 7–9 mice per genotype. No significant differences in object preferences were detected during training or STM. Both HET and KO mice were significantly impaired in the LTM preference test, indicating impaired memory in these animals. B, No differences among genotypes were found in the total object exploration time during the training, STM, or LTM, demonstrating that time spent in object exploration was not confounded with object preference. C, Graph depicting the swim time for each genotype to reach the platform during the acquisition phase (days 1–6) of water maze testing. While KO mice were impaired on day 1 compared to WT and HET mice, all three genotypes performed similarly on days 2–6. D, Remote memory was measured in a delayed probe trial (day 28). WT mice preferentially spent more time searching in the target (northeast) quadrant versus all other nontarget quadrants, whereas both HET and KO mice were impaired in the task. NE, Northeast; NW, northwest; SE, southeast; SW, southwest. E, Representative swim-trace patterns for WT, HT, and KO mice. Schematic of the four quadrants is shown in the top left panel. The target quadrant is shaded in each panel. F, Two days after the probe trial on day 28, mice were tested for their ability to relearn and remember a new position for the platform in the SW quadrant (SE). WRP KO mice were impaired on relearning compared to their WT and HET littermates, further supporting a learning and memory deficit in these mice. GI, Graph of probe trials during the reversal test on days 31, 33, and 35. Wild-type mice (G) preferentially searched the target quadrant (i.e., SW) on each day. HET mice (H) showed a mild deficit on day 31, whereas KO mice (I) could not distinguish the target from the nontarget quadrants on each probe day. J, All genotypes had a similar swim velocity during the acquisition and reversal trials, demonstrating that swimming ability was not impaired in the mutants. K, Learning and memory processes were assessed in the five trial passive avoidance test. Mice were trained once each day for five consecutive days and then tested 72 h later on day 8 for LTM. Mean latency to enter the aversive chamber is shown for each genotype. While WRP WT mice learn to avoid the aversive chamber, as indicated by increased latency to enter the chamber, WRP HET and WRP KO mice are impaired in this response. L, Shock sensitivity for each genotype was determined by ethologically scoring to an increased range of foot shock. All three genotypes responded similarly to the aversive stimulus. The amperage used in K for passive-avoidance was 0.3 μA, as indicated by the dashed line. Data are expressed as mean ± SEM. n = 5–8 mice per genotype; *p < 0.05 compared to WT, + p < 0.05 compared to day 1.

Similar articles

Cited by

References

    1. Allison DW, Gelfand VI, Spector I, Craig AM. Role of actin in anchoring postsynaptic receptors in cultured hippocampal neurons: differential attachment of NMDA versus AMPA receptors. J Neurosci. 1998;18:2423–2436. - PMC - PubMed
    1. Aspenström P. Roles of F-BAR/PCH proteins in the regulation of membrane dynamics and actin reorganization. Int Rev Cell Mol Biol. 2009;272:1–31. - PubMed
    1. Banker G, Goslin K. Developments in neuronal cell culture. Nature. 1988;336:185–186. - PubMed
    1. Bourne JN, Harris KM. Balancing structure and function at hippocampal dendritic spines. Annu Rev Neurosci. 2008;31:47–67. - PMC - PubMed
    1. Carlisle HJ, Kennedy MB. Spine architecture and synaptic plasticity. Trends Neurosci. 2005;28:182–187. - PubMed

Publication types

MeSH terms