. 2011 Apr 6;30(7):1238-50.
doi: 10.1038/emboj.2011.25. Epub 2011 Feb 15.

The mitochondrial fission factor dynamin-related protein 1 modulates T-cell receptor signalling at the immune synapse

Affiliations

The mitochondrial fission factor dynamin-related protein 1 modulates T-cell receptor signalling at the immune synapse

Francesc Baixauli et al. EMBO J. .

Abstract

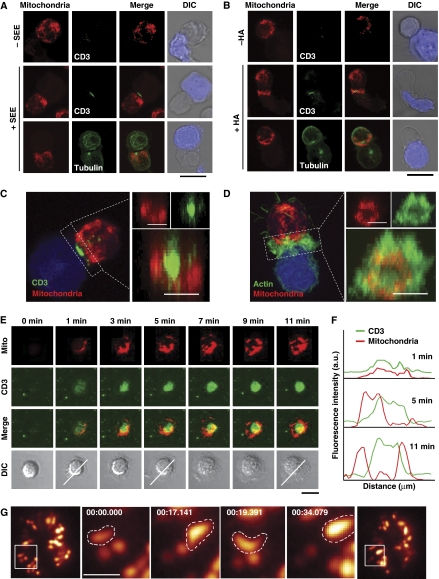
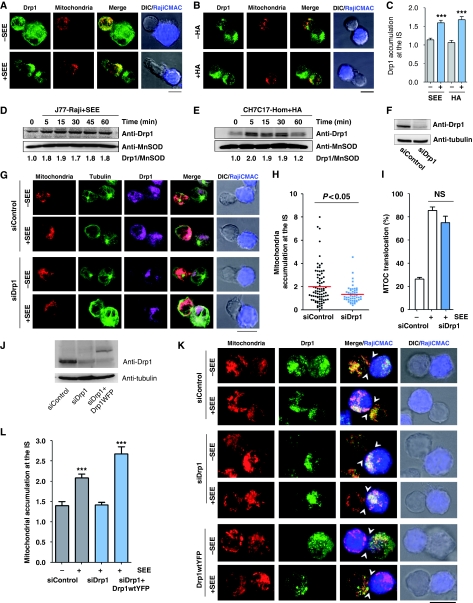
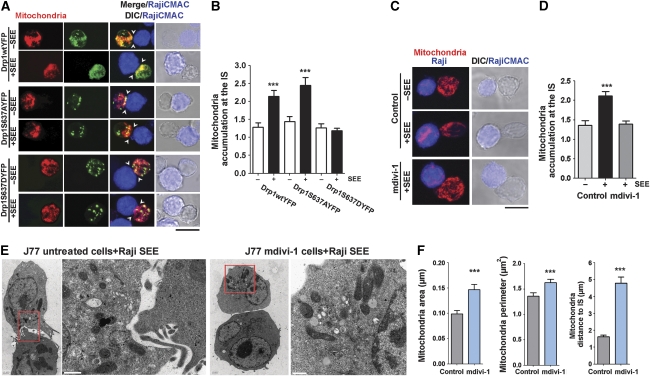
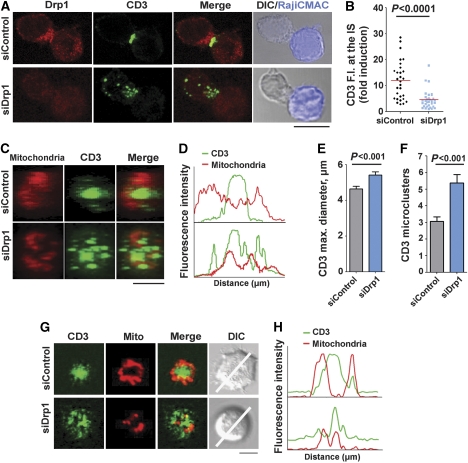
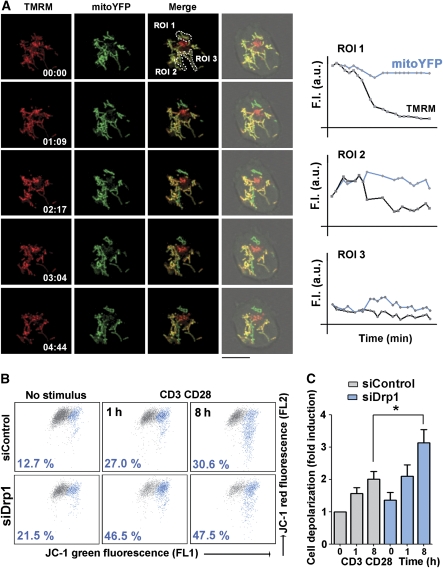
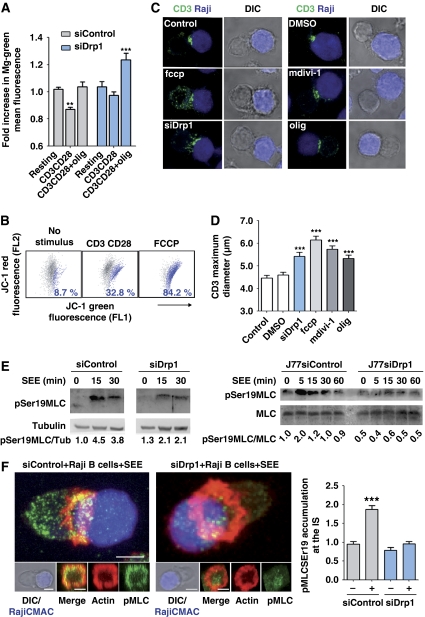
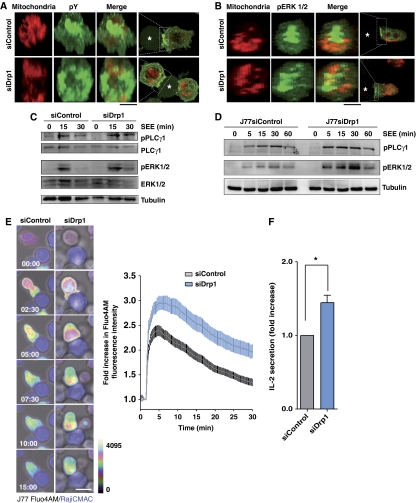
During antigen-specific T-cell activation, mitochondria mobilize towards the vicinity of the immune synapse. We show here that the mitochondrial fission factor dynamin-related protein 1 (Drp1) docks at mitochondria, regulating their positioning and activity near the actin-rich ring of the peripheral supramolecular activation cluster (pSMAC) of the immune synapse. Mitochondrial redistribution in response to T-cell receptor engagement was abolished by Drp1 silencing, expression of the phosphomimetic mutant Drp1S637D and the Drp1-specific inhibitor mdivi-1. Moreover, Drp1 knockdown enhanced mitochondrial depolarization and T-cell receptor signal strength, but decreased myosin phosphorylation, ATP production and T-cell receptor assembly at the central supramolecular activation cluster (cSMAC). Our results indicate that Drp1-dependent mitochondrial positioning and activity controls T-cell activation by fuelling central supramolecular activation cluster assembly at the immune synapse.


Conflict of interest statement

The authors declare that they have no conflict of interest.

Figures

Figure 1
Figure 1
Mitochondria translocate towards the pSMAC upon T-cell activation. (A) J77 T cells loaded with Mitotracker Orange (red) were conjugated with unpulsed or SEE-pulsed Raji B cells loaded with CMAC (blue). Cells were stained with anti-CD3 or anti-tubulin-FITC (green) to reveal TCR clustering and MTOC orientation. (B) Analysis as in (A) of HA-specific CH7C17 T cells conjugated with unpulsed or HA-pulsed Hom2 APCs. Scale bars, 10 μm. (C, D) Maximum projection of a confocal Z-stack of conjugates stimulated as in (A). Cells were stained with CD3 Ab (C) or phalloidin (D) (green) to determine the areas of the cSMAC and pSMAC. Right panels show maximal projection of 3D reconstructions from the IS. Scale bars, 5 μm. (E) Migration of mitochondria towards the IS in mitotracker-preloaded human T lymphoblasts adhered to GPI-linked ICAM-1 and anti-CD3-containing lipid bilayers. CD3 clusters (green) and mitochondria (red) were detected by confocal microscopy at the indicated times on a single confocal plane. Scale bar, 5 μm. (F) Fluorescence intensity profiles from (E) show the pSMAC localization of mitochondria at the indicated times. (G) TIRF microscopy of mitoYFP expressing T cells plated on a CD3 plus CD28 Ab surface. Magnified views show forward–backward movement of a mitochondrion at the edge of the contact with the activating surface. Scale bar, 1 μm.
Figure 2
Figure 2
Drp1 regulates mitochondrial positioning at the IS. (A, B) Immunofluorescence localization of Drp1 (green) in mitotracker-loaded T cells (red) conjugated with unpulsed or antigen-loaded APCs (CMAC loaded, blue): (A) J77 T cells plus SEE-pulsed Raji B cells; (B) CH7C17 T cells plus HA-pulsed Hom2 cells. (C) Endogenous accumulation of Drp1 at the IS in J77 T cells conjugated with unpulsed or SEE-pulsed Raji B cells or CH7C17 T cells conjugated with naive or HA-pulsed Hom2 APCs. Maximum projections of a confocal Z-stack were quantified (see Materials and methods). Data are means±s.d. of 60 conjugates from two independent experiments. (D, E) Time course of Drp1 content in the mitochondrial fractions of APC-activated J77 and CH7C17 T cells. MnSOD was used as mitochondrial marker. Blots are representative of at least three independent experiments. Drp1/MnSOD ratios are shown beneath the blot. (F) Western blot analysis of siRNA Drp1 silencing in J77 T cells after 48 h. (G) Confocal localization of mitochondria (mitotracker, red), MTOC (tubulin, green) and endogenous Drp1 (purple) in control and Drp1-silenced J77 T cells conjugated with Raji B cells (CMAC loaded, blue). Scale bar, 10 μm. (H, I) Quantification of mitochondrial accumulation and MTOC positioning at the IS in Drp1-silenced cells. Data in (H) represent means±s.d. of 60 conjugates from three experiments (P<0.05, Mann–Whitney test). (J) Western blot analysis of siRNA Drp1 silencing in J77 T cells and re-expression of YFP-fused wild-type Drp1 (Drp1WT-YFP). (K) Confocal localization of mitochondria (labelled with anti-MnSOD, red) and endogenous Drp1 (green) in control and Drp1-silenced J77 T cells conjugated with Raji B cells (CMAC loaded, blue) as in (G). Re-expression Drp1WT-YFP (green) in Drp1-silenced cells rescues mitochondrial translocation towards the IS upon conjugation with SEE-pulsed Raji B cells (CMAC loaded, blue). Arrowheads mark cell–cell contacts. Scale bar, 10 μm. (L) Accumulation of T-cell mitochondria at the IS of conjugates formed between Raji B cells and J77 T cells expressing control siRNA (88 −SEE conjugates and 231 +SEE conjugates), Drp1-siRNA (148 conjugates), and Drp1-siRNA plus Drp1WT-YFP (78 conjugates). Data are means±s.d. from two independent experiments (***P<0.001).
Figure 3
Figure 3
Drp1-mediated mitochondrial fission regulates translocation of mitochondria towards the IS. (A) Confocal localization of mitochondria in J77 T cells co-transfected with mtRFP (red) plus Drp1WT-YFP, Drp1S637AYFP or Drp1S637DYFP (green), and conjugated with unpulsed or SEE-pulsed Raji B cells (CMAC loaded, blue). Arrowheads mark cell–cell contacts. Scale bar, 10 μm. (B) Quantification of mitochondria accumulation at the IS in J77 T cells expressing Drp1WT-YFP (215 conjugates), Drp1S637AYFP (168 conjugates) and Drp1S637DYFP (141 conjugates). Data are means±s.d. from three independent experiments (***P<0.001). (C) Confocal localization of mitochondria (MnSOD, red) in J77 cells treated with DMSO (control) or mdivi-1 (50 μM, 4 h at 37°C) and conjugated with unpulsed or SEE-pulsed Raji B cells (CMAC loaded, blue). Scale bar, 10 μm. (D) Quantification of mitochondria accumulation at the IS in J77 T cells conjugated as in (C) (248 control conjugates and 100 mdivi-1-treated conjugates). Data are means±s.d. from two independent experiments (***P<0.001). (E) Transmission electron microscopy images from control or mdivi-1-treated J77 cells conjugated with SEE-loaded Raji B cells. Right panels show magnified views of mitochondria in the boxed areas. (F) Graphs showing distance of mitochondria to the IS and morphometric analysis of mitochondria area and perimeter. T-cell mitochondria were analysed in 10 SEE-dependent conjugates formed by control J77 T cells (109 mitochondria) and seven SEE-dependent conjugates formed by mdivi-1-treated J77 T cells (89 mitochondria) (***P<0.05).
Figure 4
Figure 4
Drp1 controls IS organization. (A) Distribution of Drp1 (red) and CD3 (green) in conjugates between control or Drp1-silenced J77 T cells and SEE-pulsed Raji B cells (CMAC loaded, blue). Scale bar, 10 μm (B) Quantification of CD3 accumulation at the IS, calculated from maximal confocal Z-projections in 30 cells from two independent experiments (P<0.0001, Mann–Whitney test) (C) 3D reconstructions of the cell–cell contact area in control and Drp1-silenced J77-APC conjugates; note the dispersed organization of the CD3/TCR in Drp1-silenced cells. Scale bar, 5 μm (D) Profile plot of the staining intensities of CD3 (green) and mitochondria (red) in the structures depicted in (C). (E, F) CD3 diameter (P<0.001 in Student's t-test; 58 conjugates) and CD3 cluster number (P<0.001, Mann–Whitney test; 50 conjugates) calculated from 3D reconstructions of T cell–APC contacts. Data are means±s.d. from three independent experiments. (G) Confocal analysis of IS structures formed in mitotracker-loaded control or Drp1-silenced J77 cells (red) adhered for 20 min to lipid bilayers containing anti-CD3 (green) and GPI-ICAM-1. A representative cell from one experiment of three is shown. Scale bar, 5 μm. (H) Profile plots of fluorescence intensities for CD3 and mitochondria along the lines indicated in (G).
Figure 5
Figure 5
Mitochondria depolarize at sites of TCR activation. (A) Confocal video-microscopy of mitoYFP-transfected J77 T cells loaded with the mitochondrial membrane potential dye TMRM and plated on coverslips coated with CD3 plus CD28 Abs. Images record the movement of individual mitochondria in a confocal plane at the activating surface. Profile plots show time courses of mitoYFP and TMRM fluorescence intensity in the indicated mitochondria (regions of interest, ROI), showing variations in Δψm (see Materials and methods section). (B, C) Flow cytometry analysis of mitochondrial membrane potential (Δψm FL2 versus FL1 JC-1 fluorescence) in control and Drp1-silenced human T lymphoblasts activated with anti-CD3 (10 μg/ml) plus anti-CD28 (5 μg/ml) and loaded with the mitochondrial potentiometric tracker JC-1. (B) The dot plots show a representative experiment of four. The percentage cell population with depolarized mitochondria (blue) is indicated. (C) Quantification of cells exhibiting mitochondrial depolarization in control and siDrp1-expressing human T lymphoblasts activated with CD3 plus CD28 Abs. Data are means±s.d. from four donors (*P<0.05).
Figure 6
Figure 6
Drp1 regulates T-cell activation-induced mitochondrial depolarization and myosin fuelling at the IS. (A) Relative ATP content was measured with the magnesium green probe (Mg-Gr), whose fluorescence intensity inversely correlates with intracellular ATP. Control and Drp1-silenced J77 T cells were stimulated with CD3 plus CD28 Abs and treated with vehicle or oligomycin. Data are means±s.d. from three independent experiments performed in triplicate (**P<0.01, ***P<0.001). (B) Dot plots of FL1 and FL2 JC-1 fluorescence in human T lymphoblasts activated with CD3 plus CD28 Abs and loaded with JC-1 as in Figure 5B. FCCP (250 nM) was used for maximal Δψm depolarization. A representative experiment is shown with primary T lymphoblasts from one of the three donors. (C) Confocal analysis of CD3 organization (green) in SEE-dependent conjugates formed by control J77 T cells, Drp1-silenced J77 T cells or J77 cells treated with mdivi-1, FCCP, oligomycin or vehicle. SEE-pulsed Raji B cells were CMAC loaded (blue). Scale bar, 10 μm. (D) CD3 maximum diameter in J77 T cells conjugated as in (C). The numbers of conjugates analysed for each condition were 409 (control), 136 (siDrp1), 313 (midiv-1), 339 (FCCP) and 230 (oligomycin). Data are means±s.d. from three independent experiments (***P<0.001). (E) Time course of the phosphorylation of myosin regulatory light chain at Ser19 in conjugates formed between control and Drp1-silenced human primary T lymphoblasts or J77 T cells and SEE-pulsed Raji B cells. Total expression of MLC and tubulin are shown as loading controls. Representative blots of three experiments are shown. Numbers beneath the blots denote pMLC/Tub and pMLC/MLC ratios. (F) Confocal analysis of pMLCSer19 (green), actin (red) in control and siDrp1 J77 T cells conjugated with SEE-pulsed Raji B cells (CMAC, blue). 3D stack reconstructions show pMLCSer19 and the actin ring at the contact site between control and siRNA Drp1-silenced J77 T cells and the APC. The chart shows quantification of pMLCSer19 accumulation at the IS in control and siDrp1-silenced cells in SEE-specific conjugates. Data are means±s.d. from two independent experiments (***P<0.001).
Figure 7
Figure 7
Drp1 regulates TCR signal strength. (A, B) Confocal 3D stack reconstructions showing the distribution of phosphotyrosine (pY) (A) and phosphorylated ERK1/2 (B) at the contact site between mitotracker-loaded control or Drp1-silenced J77 T cells and SEE-pulsed Raji B cells (asterisks). (C, D) Time course of the phosphorylation status of PLC-γ1 and ERK 1/2 in control and Drp1-silenced human primary T lymphoblasts (C) or J77 T cells (D) activated with SEE-pulsed Raji B cells. Tubulin or total protein expression are shown as loading controls. Immunoblots are representative of three independent experiments. (E) Confocal microscopy analysis of intracellular Ca2+ flux in control and Drp1-silenced J77 T cells preloaded with Fluo4 AM and conjugated with SEE-pulsed Raji B cells (CMAC, blue). The time profile shows the evolution of Fluo4 AM fluorescence in control (56 conjugates) and siDrp1 (86 conjugates) conjugates. Data are means±s.d. from three independent experiments (P<0.0001, two-tailed t-test). (F) IL-2 secretion from conjugates formed between SEE-pulsed Raji cells and control or Drp1-silenced J77 cells. IL-2 was measured by ELISA 16 h after initial conjugate formation. Data are means±s.d. of six independent experiments (*P<0.05).

Comment in

References

    1. Calabia-Linares C, Robles-Valero J, De La Fuente H, Perez-Martínez M, Martin-Cofreces NB, Alfonso-Pérez M, Gutierrez-Vázquez C, María Mittelbrunn M, Ibiza SU-O FR, Aguado-Ballano C, Sánchez-Sorzano CO, Sánchez-Madrid F, Veiga E (2011) Endosomal clathrin drives actin accumulation at the immunological synapse. J Cell Sci (doi:10.1242/jcs078832) - PubMed
    1. Campello S, Lacalle RA, Bettella M, Manes S, Scorrano L, Viola A (2006) Orchestration of lymphocyte chemotaxis by mitochondrial dynamics. J Exp Med 203: 2879–2886 - PMC - PubMed
    1. Carrasco YR, Fleire SJ, Cameron T, Dustin ML, Batista FD (2004) LFA-1/ICAM-1 interaction lowers the threshold of B cell activation by facilitating B cell adhesion and synapse formation. Immunity 20: 589–599 - PubMed
    1. Cassidy-Stone A, Chipuk JE, Ingerman E, Song C, Yoo C, Kuwana T, Kurth MJ, Shaw JT, Hinshaw JE, Green DR, Nunnari J (2008) Chemical inhibition of the mitochondrial division dynamin reveals its role in Bax/Bak-dependent mitochondrial outer membrane permeabilization. Dev Cell 14: 193–204 - PMC - PubMed
    1. Cereghetti GM, Stangherlin A, Martins de Brito O, Chang CR, Blackstone C, Bernardi P, Scorrano L (2008) Dephosphorylation by calcineurin regulates translocation of Drp1 to mitochondria. Proc Natl Acad Sci USA 105: 15803–15808 - PMC - PubMed

Publication types

MeSH terms