Comparative Study
. 2011 Feb 15:2:201.
doi: 10.1038/ncomms1200.

Gipc3 mutations associated with audiogenic seizures and sensorineural hearing loss in mouse and human

Affiliations
Free PMC article
Comparative Study

Gipc3 mutations associated with audiogenic seizures and sensorineural hearing loss in mouse and human

Nikoletta Charizopoulou et al. Nat Commun. .
Free PMC article

Abstract

Sensorineural hearing loss affects the quality of life and communication of millions of people, but the underlying molecular mechanisms remain elusive. Here, we identify mutations in Gipc3 underlying progressive sensorineural hearing loss (age-related hearing loss 5, ahl5) and audiogenic seizures (juvenile audiogenic monogenic seizure 1, jams1) in mice and autosomal recessive deafness DFNB15 and DFNB95 in humans. Gipc3 localizes to inner ear sensory hair cells and spiral ganglion. A missense mutation in the PDZ domain has an attenuating effect on mechanotransduction and the acquisition of mature inner hair cell potassium currents. Magnitude and temporal progression of wave I amplitude of afferent neurons correlate with susceptibility and resistance to audiogenic seizures. The Gipc3(343A) allele disrupts the structure of the stereocilia bundle and affects long-term function of auditory hair cells and spiral ganglion neurons. Our study suggests a pivotal role of Gipc3 in acoustic signal acquisition and propagation in cochlear hair cells.


Figures

Figure 1
Figure 1. Positional cloning of the ahl5 locus.
(a) ABR thresholds at click (orange), 8 (green), 16 (purple) and 32 kHz (red) of congenic BLSW.CAST-+/ahl5 (n=83) and BLSW.CAST-ahl5/ahl5 (n=59) mice at 8 weeks of age. Hearing thresholds (dBSPL) were significantly elevated for the BLSW.CAST-ahl5/ahl5 animals compared with BLSW.CAST-+/ahl5 (ANOVA, P<0.001). Data are given as mean±s.d. (b) The ahl5 95% confidence interval (CI) on chromosome 10 (MMU10) defined by markers D10Mit20 and D10Mit95 is shown. Refined genotyping of two congenic lines 10.R and 10.2 delimited the ahl5 critical interval in a 2.19 Mbp region (red box) defined by markers D10Ntra205 and D10Ntra222. Blue bars at the bottom of the map represent the congenic segments from CAST/EiJ introgressed onto the BLSW genetic background (red lines). The jams1 locus delimited by the gene Basigin (Bsg) and marker D10Mit140 on MMU10 is shown (orange box). Physical location of Gipc3 within the ahl5 interval is given. Position of the markers is given in kilobase pairs (kbp). (c) Gipc3 has six exons and is predicted to encode a 297 amino-acid protein with a central PDZ domain (blue box) flanked by amino- and C-terminal GIPC homologous domains GH1 and GH2 (grey boxes). Position of the mutation (red annotation) and polyclonal antisera Pb867, Pb869 and Pb877 (green boxes) is shown. (d) Sequencing chromatograms demonstrating the 343G>A transition in wild-type (left) and mutant (right) are shown. The nucleotide (A, adenine) and amino acid (Arg, arginine) changes are shown in red. (e) ABR thresholds (dBSPL) at click (orange), 8 (green), 16 (purple) and 32 kHz (red) of NIH Swiss homozygous for the wild-type (343G/G; n=9) and mutant (343A/A; n=9) Gipc3 alleles. Homozygous (343A/A) NIH Swiss at 6 weeks of age had significantly higher thresholds at all tested stimuli (P<0.0001; ANOVA). Data are given as mean±s.d. (f) ClustalW alignment of the amino-acid sequence of Gipc3 homologues and the location of the Gly115Arg relative to the secondary structure, obtained from the GIPC2 crystal structure (DOI:10.2210/pdb3gge/pdb) is shown. Gly115 maps to a loop (yellow), connecting to β strands, βB (green) and βC (blue).
Figure 2
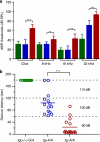
Figure 2. Sensorineural hearing loss and audiogenic seizures in BLSW.
(a) ABR thresholds (dBSPL) of BLSW at 4 (orange symbol, n=18) and 52 (red, n=20) weeks age compared with 4-week-old C3HeB/FeJ (blue, n=9) are given as mean±s.d. (b) ABR thresholds (dBSPL) at the 16k Hz stimulus in 2- (n=6) and 12-months-old (n=17) BLSW.CAST-+/+ (blue), and in 2-month-old BLSW.CAST-+/ahl5 (green, n=52), and 2- (n=9) and 12-months-old (n=20) BLSW (red) are given as mean±s.d. ABR thresholds in 12-month-old females (12f, n=30) and males (12 m, n=30) are given. NS P>0.05, ***P<0.001 (ANOVA). (c) DPOAE levels (dBSPL) at the 2f1-f2 frequency are plotted against the f2 frequency (kHz) for 55 dBSPL (left), 65 dBSPL (middle) and 75 dBSPL (right) L2 levels. Emission levels relative to noise floor of C3HeB/FeJ (blue, n=25) and BLSW (red, n=16) mice at 4 weeks of age are given as mean±s.e.m. (d) Endocochlear potential measurements of C3HeB/FeJ (blue, n=5) and BLSW (red, n=15) mice. Each circle refers to one measurement and the lines indicate the mean in each strain. Values are given in millivolt (mV). (e) Audiogenic seizure susceptibility of C3HeB/FeJ (blue, n=5), BLSW (dark red, n=14) and congenic BLSW.CAST-+/+ (blue, n=9), BLSW.CAST-+/ahl5 (green, n=23), BLSW.CAST-ahl5/ahl5 (light red, n=34) at 3 weeks of age using white noise stimuli of 90, 100 and 110 dBSPL (dotted lines). Each circle represents one animal and lines indicate the mean of the seizure latency of each strain in seconds. NS P>0.05; ***P<0.001. NS, not significant.
Figure 3
Figure 3. Analysis of Gipc3 transgenic mice.
(a) ABR thresholds (dBSPL) for click and pure tone pips at 8, 16 and 32 kHz are given in bars as mean±s.d. for backcross progeny tg(+/−) G/A (green, n=20), tg+A/A (blue, n=36) and tg-A/A (red, n=37). Green bars represent pooled data from backcross mice that were either positive or negative (+/−) for the transgene. (b) Audiogenic seizure susceptibility of tg(+/−) G/A (green symbol, n=10), tg+A/A (blue, n=) and tg-A/A (red, n=16) was assessed at 3 weeks of age using white noise stimuli (90, 100 and 110 dBSPL; dotted lines). Each circle represents one measurement and lines indicate the mean of the seizure latency of each genotype in seconds. **P<0.01; ***P<0.001.
Figure 4
Figure 4. GIPC3 mutations and human deafness.
(a) Sequencing chromatograms indicating the guanine (G) and adenine (A) in family W98-042 (top) and control (bottom) at nucleotide position c.903 changing the tryptophan (Trp) residue at position p.301 to a stop codon (p.Trp301X). (b) Shown is the two-generation pedigree of consanguinues family W98-042 with first-cousin parents. Hearing-impaired brothers homozygous for the mutation (II.I and II.3; A/A) are indicated by filled black boxes and normal hearing relatives are indicated by open symbols. (c) Mean pure-tone audiograms of the two affected individuals II.1 and II.3 of family W98-042 at different ages are given in years (y). Note the threshold shifts of 80–120 dB HL above normal hearing levels. (d) Sequence chromatogram showing c.785T>G (p.Leu262Arg) mutation in GIPC3 in individual II-5. (e) Pedigree of the Indian family with prelingual, profound autosomal recessive non-syndromic hearing impairment. The c.785 genotype is shown. Open symbols unaffected; filled black symbols affected; double line consanguineous event. (f) Multi-sequence alignment of GIPC family proteins showing the high conservation of the Leu262 residue.
Figure 5
Figure 5. Stereocilia and cochlear pathology in BLSW mice.
(a) Confocal images of C3HeB/FeJ and BLSW phalloidin-stained organs of Corti at P3 and P5 from the mid-apical and basal turn are shown. Note the compromised hair bundle structure of OHC (white arrow) and collapsed bundle of IHC (arrowhead) in BLSW mice. Scale bar, 5 μm. (b) Shown are scanning electron microscopy images of OHC (arrow) and IHC (arrowhead) stereocilia bundles at P14. Compare the inward-bended stereocilia on BLSW OHCs to the organized and upright standing bundles in C3HeB/FeJ. Compare the sparse IHC stereocilia in BLSW with the dense bundle in C3HeB/FeJ. Scale bar, 2 μm. (c) Shown are confocal images of IHC stereocilia bundles at P21. Note the thinner (arrow) and shorter (star) stereocilia in BLSW. Scale bar, 5 μm. (d) Images of tolouidine-stained cross-sections of the organ of Corti and spiral ganglion are shown. Age and region of the cochlea is indicated. Note the normal appearance of organ of Corti (arrows point to OHC and arrowhead to IHC) and spiral ganglion neurons (arrow) in 8-week-old BLSW mice, but base to mid–apex degeneration (red star) in 52-week-old BLSW cochleae. Scale bar, 20 μm (top panel) and 50 μm (bottom panel).
Figure 6
Figure 6. Protein blot analysis and immunolocalization of Gipc3.
(a) Western blot analysis of Gipc3343G transfected (+) and untransfected (−) HEK293T cell lysates using Gipc3-specific polyclonal antiserum Pb867 detecting a single ∼40 kDa band (black arrow). (b) Immunoblot analysis of protein extracts from cochlea and testis from BLSW and C3HeB/FeJ (C3 H) mice with anti-Gipc3 antiserum Pb867. Lysates from HeLa cells transfected with the wild-type Gipc3343G construct were included as control. The ∼40 kDa band (black arrow) was detected in both tissues from C3HeB/FeJ wild-type mice. The similar ∼40 kDa band was detected with reduced intensity in mutant BLSW cochlea and testis. The ∼37 kDa band (arrow head) and ∼29 kDa band (dot, presumably nonspecific) are indicated. (c) Quantitative analysis of wild-type Gipc3(115Gly) and mutant Gipc3(115Arg) expression in lysates from transiently transfected HEK293T cells with varying amounts of protein loaded (10 and 30 μg) for wild-type Gipc3343G and mutant Gipc3343A. Protein blots were probed with the anti-Gipc3 antiserum Pb867and anti-α-actin antibody. (d) Densitometric analysis of Gipc3 expression from wild-type Gipc3(115Gly) and mutant Gipc3(115Arg)-transfected HEK293T cells. The data are represented as mean±s.e.m., **P<0.01 (n=6, t-test). Confocal images of cryosections of organ of Corti (e) and spiral ganglion (f) stained with Pb867 antibody (red) demonstrating Gipc3 localization in IHCs (arrow head) and OHCs (arrow) and spiral ganglion (arrow). Confocal images of organ of Corti of C3HeB/FeJ (g, h, j) and BLSW (i, k, l) demonstrating Gipc3 (g–i) and Vglut3 (k) and myosin VI (l) localization; (il) counterstained with phalloidin (green); arrows point to positive staining. (ek) Counterstained with 4,6-diamidino-2-phenylindole (blue). (l) No Pb867-staining is seen in stereocilia of IHC (arrow head); scale bar, 5 μm (el).
Figure 7
Figure 7. Electrophysiological measurements from BLSW and control mice.
(a) Families of transduction currents recorded from OHC (n=8–11) and IHC (n=3–10) collected from the apical turn of BLSW and control mice at P6 and P12 are shown. The scale bar applies to all four families. The cells were voltage-clamped at −64 mV. The data shown at P6 are representative of the mean, whereas the data shown at P12 represent the largest currents obtained at that stage. (b) Summary of mean maximal currents recorded from a total of 62 hair cells of control (blue bars) and BLSW (red). The data were normalized to mean maximal control currents in each condition. Bars indicate mean±s.e.m.; **P<0.005; ***P<0.00005 (two-population t-test). (c) Families of voltage-dependent currents evoked by 50-msec steps that ranged between −124 and 96 mV in 20 mV increments. Currents were recorded from IHC at P6 (top panel) and at P13 (control, n=5) and P12 (BLSW, n=8, bottom panel). The scale bar applies to all current families. (d) Membrane potentials recorded in current-clamp mode in response to current steps at the amplitudes indicated.
Figure 8
Figure 8. Audiogenic seizure progression correlates with ABR wave I amplitude.
(a) Shown are audiogenic seizure latencies (seconds) after white noise stimulation at 90, 100 and 110 dBSPL (dotted lines) of BLSW (red, n≥9) and C3HeB/FeJ (blue, n≥3) as function of weeks of age. Each circle represents one measurement and the line indicates the mean of the response. (b) Shown are ABR wave I amplitudes obtained with a 100-dBSPL click stimulus of BLSW (red, n≥8) and C3HeB/FeJ (blue, n≥9) as function of weeks of age. Data are given as mean±s.d. (c, d) Shown are ABR amplitudes for waves I through V following a 100-dBSPL click stimulus of BLSW (red, n≥9) and C3HeB/FeJ (blue, n≥10) at 2 (c) and 6 (d) weeks of age. Data are given as mean±s.d. (e) Shown are ABR wave I latencies obtained with a 100-dBSPL click stimulus of BLSW (red, n≥8) and C3HeB/FeJ (blue, n≥9) as function of weeks of age. Data are given as mean±s.d. (f) ABR thresholds shown are obtained with a click stimulus of BLSW (red, n≥9) and C3HeB/FeJ (blue, n≥2) as function of weeks of age. Data are given as mean±s.d. Dotted connecting lines: linear regression lines. NS P>0.05; *P<0.05; **P<0.01; ***P<0.001, ANOVA. NS, not significant.

References

    1. NIDCD. Statistics and epidemiology, www.nidcd.nih.gov (2010).
    1. Christensen K., Frederiksen H. & Hoffman H. J. Genetic and environmental influences on self-reported reduced hearing in the old and oldest old. J. Am. Geriatr. Soc. 49, 1512–1517 (2001). - PubMed
    1. Friedman R. A. et al.. GRM7 variants confer susceptibility to age-related hearing impairment. Hum. Mol. Genet. 18, 785–796 (2009). - PMC - PubMed
    1. Gates G. A., Couropmitree N. N. & Myers R. H. Genetic associations in age-related hearing thresholds. Arch. Otolaryngol. Head Neck. Surg. 125, 654–659 (1999). - PubMed
    1. Karlsson K. K., Harris J. R. & Svartengren M. Description and primary results from an audiometric study of male twins. Ear Hear. 18, 114–120 (1997). - PubMed

Publication types

Substances