. 2011 Apr;56(4):316-23.
doi: 10.1038/jhg.2011.12. Epub 2011 Feb 17.

Genome-wide association study identifies genetic variants influencing F-cell levels in sickle-cell patients

Affiliations

Genome-wide association study identifies genetic variants influencing F-cell levels in sickle-cell patients

Pallav Bhatnagar et al. J Hum Genet. 2011 Apr.

Abstract

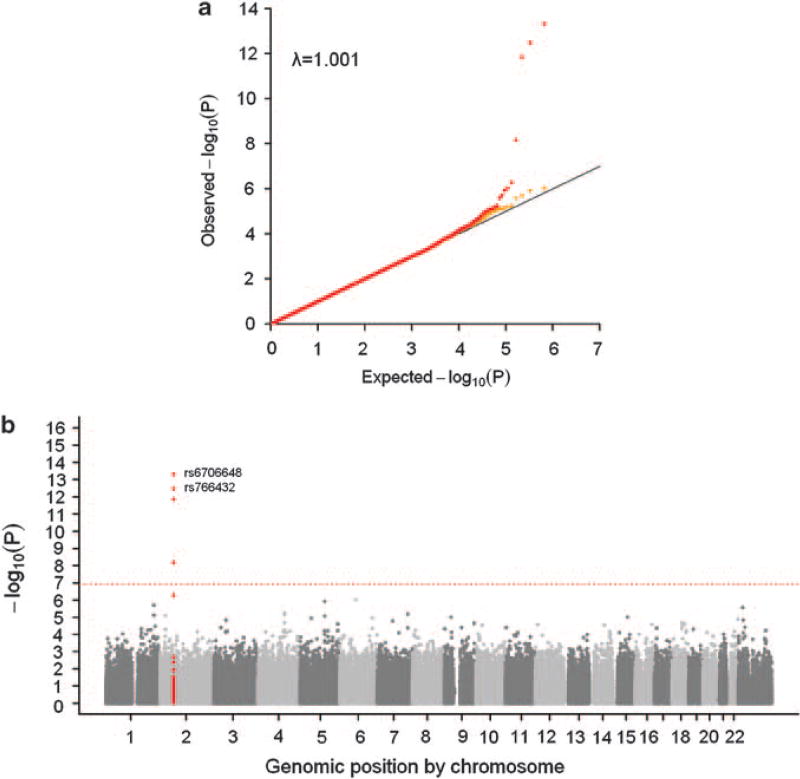
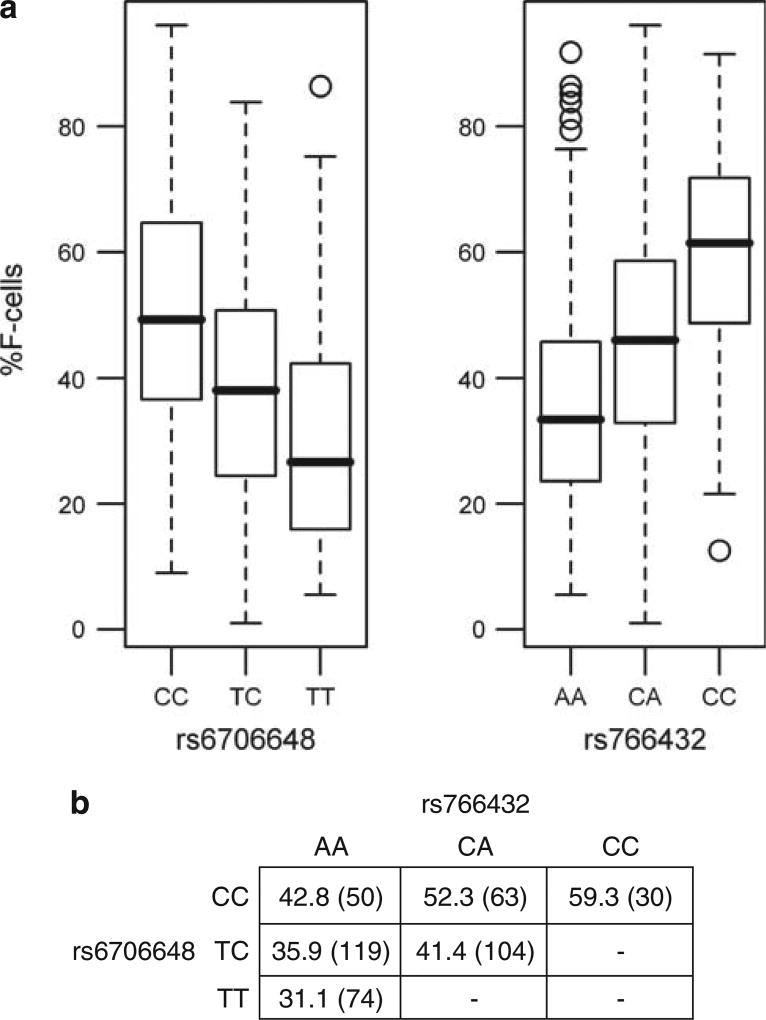
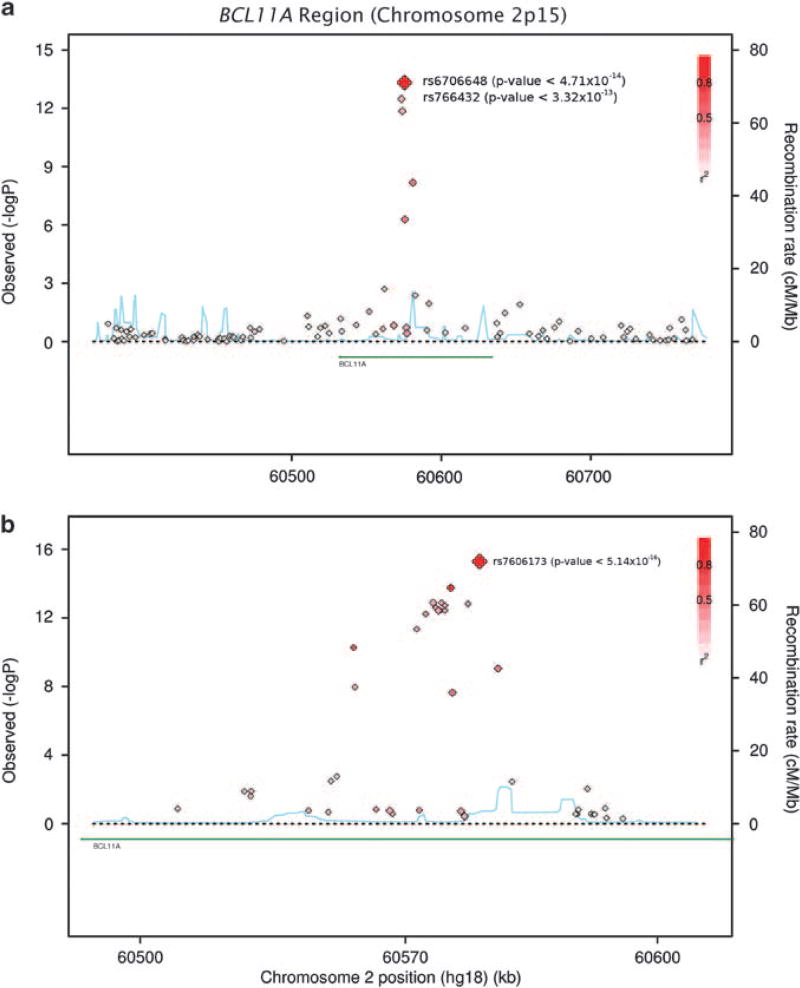
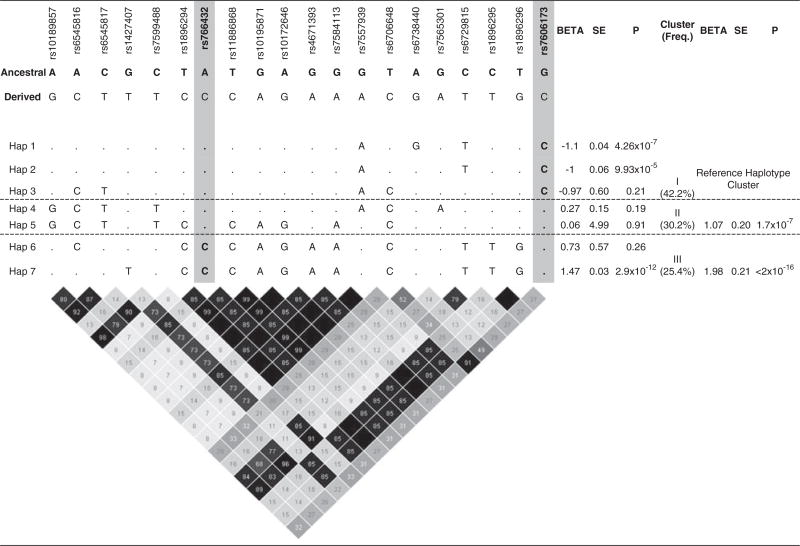
Fetal hemoglobin (HbF) level has emerged as an important prognostic factor in sickle-cell disease (SCD) and can be measured by the proportion of HbF-containing erythrocytes (F-cells). Recently, BCL11A (zinc-finger protein) was identified as a regulator of HbF, and the strongest association signals were observed either directly for rs766432 or for correlated single-nucleotide polymorphisms (SNPs). To identify additional independently associated genetic variants, we performed a genome-wide association study (GWAS) on the proportion of F-cells in individuals of African ancestry with SCD from the Silent Infarct Transfusion (SIT) Trial cohort. Our study not only confirms the association of rs766432 (P-value <3.32 × 10(-13)), but also identifies an independent novel intronic SNP, rs7606173, associated with F-cells (P-value <1.81 × 10(-15)). The F-cell variances explained independently by these two SNPs are ∼13% (rs7606173) and ∼11% (rs766432), whereas, together they explain ∼16%. Additionally, in men, we identify a novel locus on chromosome 17, glucagon-like peptide-2 receptor (GLP2R), associated with F-cell regulation (rs12103880; P-value <3.41 × 10(-8)). GLP2R encodes a G protein-coupled receptor and involved in proliferative and anti-apoptotic cellular responses. These findings highlight the importance of denser genetic screens and suggest further exploration of the BCL11A and GLP2R loci to gain additional insight into HbF/F-cell regulation.


Conflict of interest statement

CONFLICT OF INTEREST

The authors declare no conflict of interest.

Figures

Figure 1
Figure 1
Summary of the genome-wide association results of the proportion of F-cells in the SIT Trial cohort. (a) Q–Q plot of the observed versus the expected P-values from an additive genetic model for the entire set of 660 740 SNPs (red), and after removing genome-wide significant and their neighboring ±100kb region SNPs (yellow). (b) Manhattan plot for F-cells association results plotted against the position on each chromosome. The red color peak on chromosome 2 corresponds to the BCL11A region (±100kb SNPs from rs6706648) and the red horizontal line represents a permutation-based genome-wide significant threshold (P-value <1.27×10⁻⁷).
Figure 2
Figure 2
Distribution of F-cells by observed genotypes. (a) Box plot demonstrating the distribution of untransformed F-cells within each genotype group of rs6706648 and rs766432 SNPs. Each box represents the F-cell values between the 25th and 75th quartiles, and the dark black line within the boxes indicates the median values. (b) Mean distribution of the untransformed F-cells in individuals by genotype combination. The number of individuals within each genotype combination is shown in parentheses.
Figure 3
Figure 3
Regional association plot of genotyped and imputed SNPs from the BCL11A intron 2 region. (a) Genotyped SNPs are plotted with their P-values (−log10 P) as a function of genomic position (UCSC human genome hg18 coordinates). Estimated recombination rates observed in HapMap YRI (using a window of ±200Kb) are plotted to reflect the local LD structure around rs6706648. (b) Regional association plot showing the significance of the imputed BCL11A SNPs. The significance of the imputed SNPs is plotted with their P-values (−log10 values) as a function of genomic position (UCSC human genome hg18 coordinates). Estimated recombination rates observed in HapMap YRI are plotted to reflect the local LD structure around the most significant SNP (rs7606173) observed in our study. The imputation of the plotted SNPs were performed using the YRI and CEU combined reference panel from the 1000 Genomes Project.
Figure 4
Figure 4
Genetic association of inferred haplotypes from the rs766432 and rs7606173 region LD block. In total, seven common haplotypes (frequency >1%) were inferred using 20 SNPs from the rs766432 and rs7606173 region LD block. The top panel provides the information of the ancestral alleles based on the similarity with non-human primates. The period symbol (‘.’) indicates the ancestral allele and letters in place of period symbol indicate derived alleles. The inferred haplotypes are grouped in three clusters (I, II and III) and cluster I is defined as the ‘reference haplotype cluster’.

Similar articles

Cited by

References

    1. Motulsky AG. Frequency of sickling disorders in U.S. blacks. N. Engl. J. Med. 1973;288:31–33. - PubMed
    1. Platt OS, Brambilla DJ, Rosse WF, Milner PF, Castro O, Steinberg MH, et al. Mortality in sickle cell disease. Life expectancy and risk factors for early death. N. Engl. J. Med. 1994;330:1639–1644. - PubMed
    1. Driss A, Asare KO, Hibbert JM, Gee BE, Adamkiewicz TV, Stiles JK. Sickle cell disease in the post genomic era: a monogenic disease with a polygenic phenotype. Genomics Insights. 2009;30:23–48. - PMC - PubMed
    1. Watson J. The significance of the paucity of sickle cells in newborn Negro infants. Am. J. Med. Sci. 1948;215:419–423. - PubMed
    1. Jacob GF, Raper AB. Hereditary persistence of foetal haemoglobin production, and its interaction with the sickle-cell trait. Br. J. Haematol. 1958;4:138–149. - PubMed

Publication types