. 2010 Dec 1;2(1):26-36.
doi: 10.1364/BOE.2.000026.

The structural origin of second harmonic generation in fascia

The structural origin of second harmonic generation in fascia

Maxime Rivard et al. Biomed Opt Express. .

Abstract

Fascia tissue is rich in collagen type I proteins and can be imaged by second harmonic generation (SHG) microscopy. While identifying the overall alignment of the collagen fibrils is evident from those images, the tridimensional structural origin for the observation of SHG signal is more complex than it apparently seems. Those images reveal that the noncentrosymmetric (piezoelectric) structures are distributed heterogeneously on spatial dimensions inferior to the resolution provided by the nonlinear optical microscope (sub-micron). Using piezoresponse force microscopy (PFM), we show that an individual collagen fibril has a noncentrosymmetric structural organization. Fibrils are found to be arranged in nano-domains where the anisotropic axis is preserved along the fibrillar axis, while across the collagen sheets, the phase of the second order nonlinear susceptibility is changing by 180 degrees between adjacent nano-domains. This complex architecture of noncentrosymmetric nano-domains governs the coherent addition of 2ω light within the focal volume and the observed features in the SHG images taken in fascia.

Keywords: (180.4315) Nonlinear microscopy; (190.4160) Multiharmonic generation.


Figures

Fig. 1
Fig. 1
Experimental setup used for the SHG experiments: forward and backward SHG imaging microscopy, forward SHG microscopy with a variable collection numerical aperture (iris) and SHG under tight focusing near a quartz interface (radiation pattern measurement). H, half-wave plate; P, polarizer; D, Dichroic mirror; O1, illumination objective (0.8 NA, water); O2, collection objective (1.15 NA, water); F, filters; PMT, photomultiplier tube. In the forward direction, the detector is whether a PMT or a CCD.
Fig. 2
Fig. 2
SHG images of fascia tissue in (a) forward and (b) backward direction. Signal profiles taken along the same lines in forward and backward images (c) longitudinally and (d) transverse to the collagen sheets. Longitudinal and transverse (to the fibrillar axis) intensity profiles were taken along the yellow lines. The boundaries between the collagen sheets are clear in the backward direction.
Fig. 3
Fig. 3
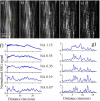
SHG images of fascia tissue taken with different collection NA by varying the aperture of the collection objective with an iris. Forward signal was collected with (a) 1,15 NA, (b) 0,55 NA, (c) 0,35 NA, (d) 0,19 NA and (e) 0,07 NA. Longitudinal and transversal (to the fibrillar axis) intensity profiles taken in (a-e) along the yellow lines shown in (a) are also presented in (f) and (g). New modulations in the signal appear along those structures when the collection NA used to take the image is smaller than 0.55.
Fig. 4
Fig. 4
Experimental signal profiles when (i) the focus travels through (a) the lower and (b) the upper interface of the quartz crystal. When the NA used for collection is reduced, the SHG signal profile becomes asymmetric in Z at both interfaces. Images of the collimated radiation pattern are taken with a CCD camera while the focus is near the upper interface: (c) 6 μm in the crystal, (d) 4 μm in the crystal, (e) 2 μm in the crystal, (f) at the interface, (g) 2 μm in the air, and (h) 4 μm in the air. (j) The radial intensity profile in function of the equivalent NA (which is a measure of the angle of emission). This demonstrates that the position of the focus in the χ(2) distribution can be responsible for changes in the radiation pattern.
Fig. 5
Fig. 5
Piezoresponse force microscopy experiment on fascia. a) sample topography, 5μm scan, (b) topography, zoom of (a), and (c) piezoresponse image [of the same area as in (b)] showing the orientation of the piezoelectric tensor. The piezoelectric response in fascia has either a positive or negative value (white or a dark contrast).
Fig. 6
Fig. 6
The dependence of the PFM signal (in-plane measurements) on the angle between the cantilever and the collagen fibril axis, averaged over a 5μm of fibril length. The single collagen fibril was rotated in steps of 15 degrees. The insets illustrate two of the image sets (each composed of topography at left and PFM image at right, 5μm scans) used to construct the graph. The yellow arrows in the PFM images illustrate the detection direction.

References

    1. Campagnola P. J., Millard A. C., Terasaki M., Hoppe P. E., Malone C. J., Mohler W. A., “Three-dimensional high-resolution second-harmonic generation imaging of endogenous structural proteins in biological tissues,” Biophys. J. 82(1), 493–508 (2002).10.1016/S0006-3495(02)75414-3 - DOI - PMC - PubMed
    1. Brown E., McKee T., diTomaso E., Pluen A., Seed B., Boucher Y., Jain R. K., “Dynamic imaging of collagen and its modulation in tumors in vivo using second-harmonic generation,” Nat. Med. 9(6), 796–801 (2003).10.1038/nm879 - DOI - PubMed
    1. Stoller P., Celliers P. M., Reiser K. M., Rubenchik A. M., “Quantitative second-harmonic generation microscopy in collagen,” Appl. Opt. 42(25), 5209–5219 (2003).10.1364/AO.42.005209 - DOI - PubMed
    1. Williams R. M., Zipfel W. R., Webb W. W., “Interpreting second-harmonic generation images of collagen I fibrils,” Biophys. J. 88(2), 1377–1386 (2005).10.1529/biophysj.104.047308 - DOI - PMC - PubMed
    1. Yeh A. T., Hammer-Wilson M. J., Van Sickle D. C., Benton H. P., Zoumi A., Tromberg B. J., Peavy G. M., “Nonlinear optical microscopy of articular cartilage,” Osteoarthritis Cartilage 13(4), 345–352 (2005).10.1016/j.joca.2004.12.007 - DOI - PubMed

LinkOut - more resources