. 2011;17(7-8):762-70.
doi: 10.2119/molmed.2010.00202. Epub 2011 Feb 9.

Chemokine expression by small sputum macrophages in COPD

Affiliations

Chemokine expression by small sputum macrophages in COPD

Marion Frankenberger et al. Mol Med. 2011.

Abstract

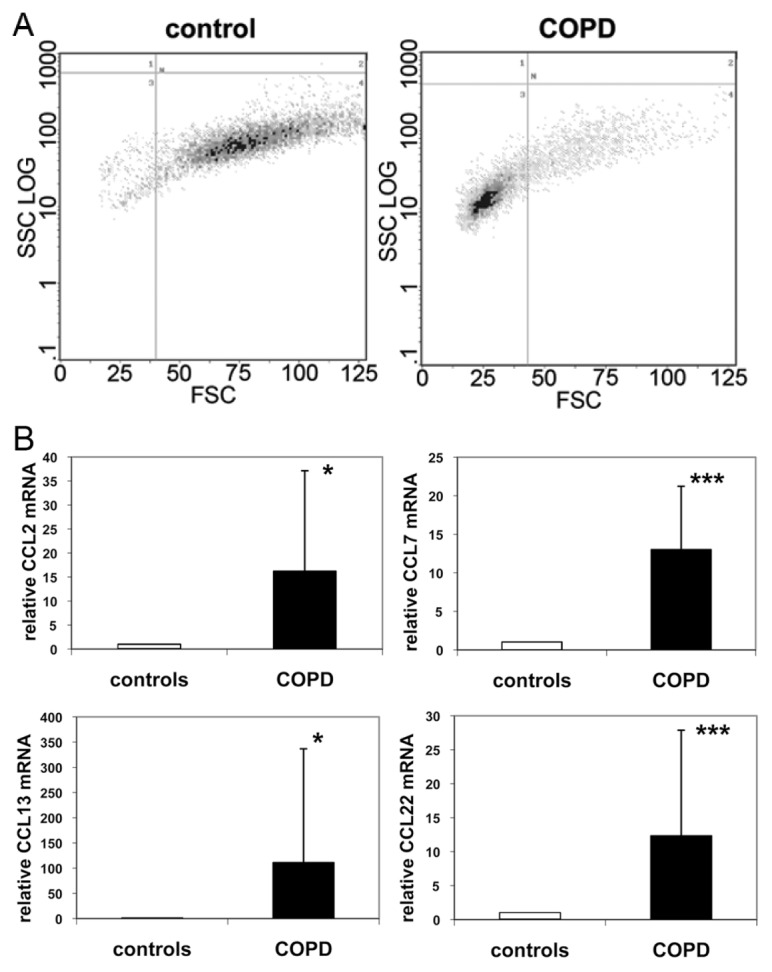
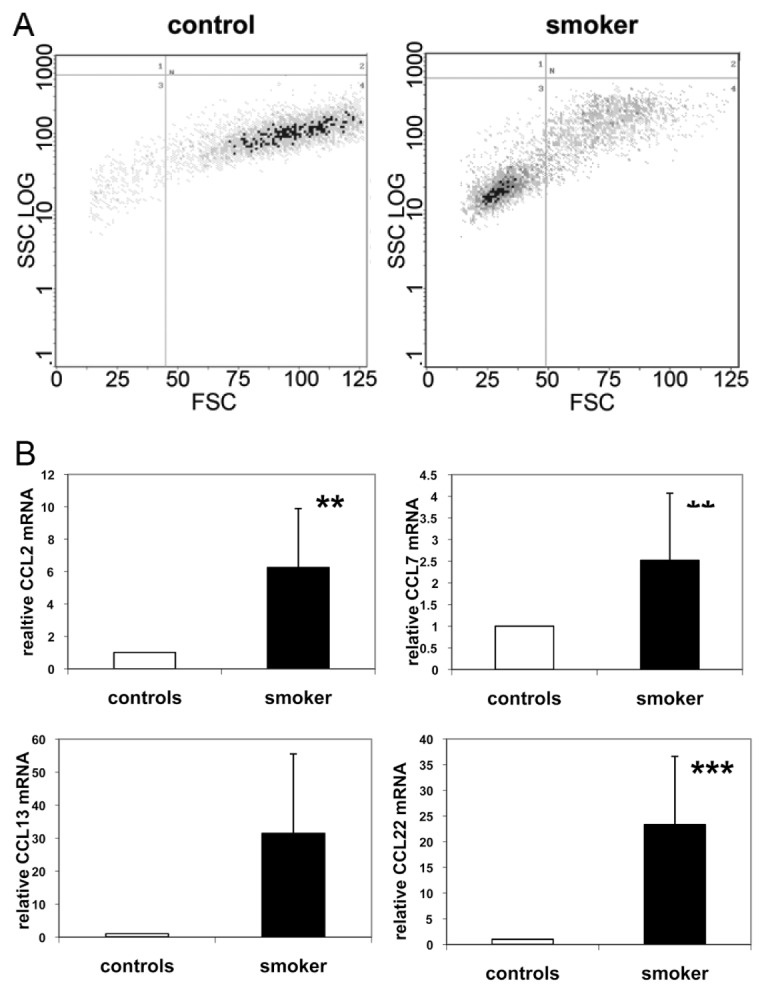
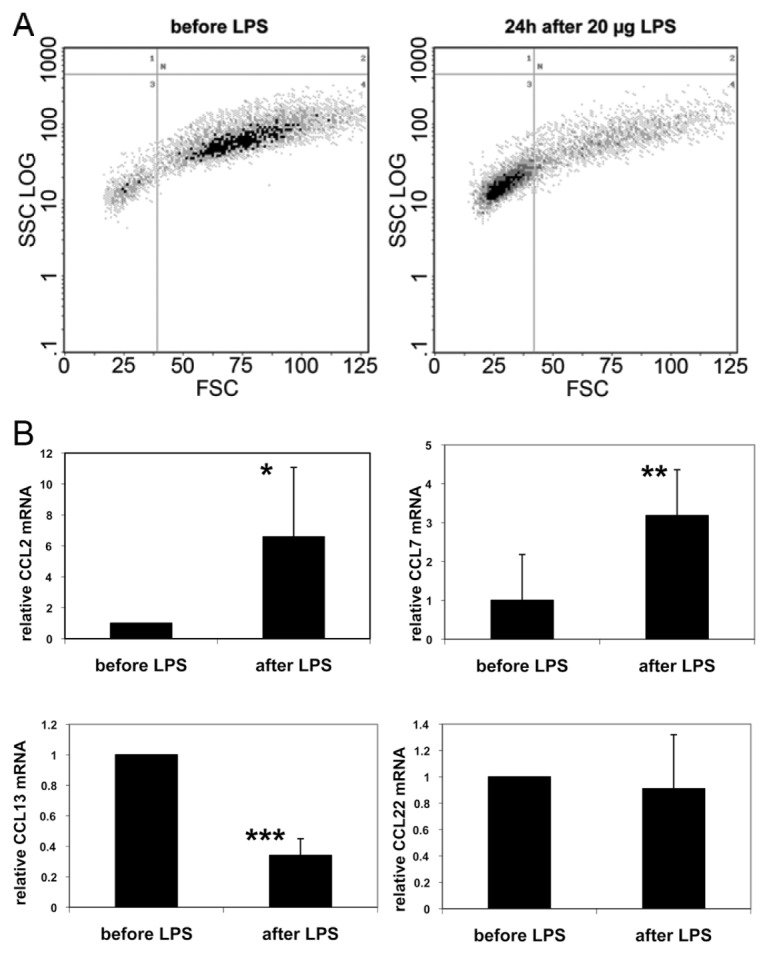
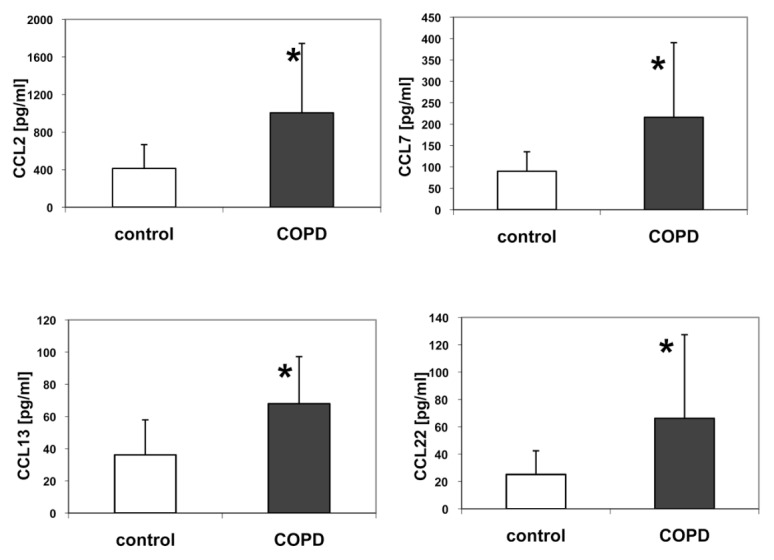
Small sputum macrophages represent highly active cells that increase in the airways of patients with inflammatory diseases such as chronic obstructive pulmonary disease (COPD). It has been reported often that levels of cytokines, chemokines and pro-teases are increased in sputum supernatants of these patients. In COPD, the small sputum macrophages may contribute to these supernatant proteins and recruit additional cells via specific chemokine expression patterns. We therefore investigated the expression profile of chemokines in sputum macrophages obtained from COPD patients in comparison to cells from healthy donors and cells isolated after inhalation of lipopolysaccharide (LPS). We used the minimally invasive procedure of sputum induction and have purified macrophages with the RosetteSep technology. Using macrophage purification and flow cytometry we show that in COPD small sputum macrophages account for 85.9% ± 8.3% compared with 12.9% ± 7.1% of total macrophages in control donors. When looking at chemokine expression we found, for the small macrophages in COPD, increased transcript and protein levels for CCL2, CCL7, CCL13 and CCL22 with a more than 100-fold increase for CCL13 mRNA (P < 0.001). Looking at active smokers without COPD, there is a substantial increase of small macrophages to 60% ± 15% and, here, chemokine expression is increased as well. In a model of airway inflammation healthy volunteers inhaled 20 μg of lipopolysaccharide (LPS), which resulted in an increase of small sputum macrophages from 18% ± 19% to 64% ± 25%. The pattern of chemokine expression was, however, different with an upregulation for CCL2 and CCL7, while CCL13 was downregulated three-fold in the LPS-induced small macrophages. These data demonstrate that sputum macrophages in COPD show induction of a specific set of CCL chemokines, which is distinct from what can be induced by LPS.


Figures

Figure 1
Figure 1
(A) Enrichment of sputum macrophages by RosetteSep technique. Induced sputum samples from a healthy individual (left panel) and a COPD patient (right panel) were used to isolate the macrophage populations by using the Rosette-Sep technique. Purified cells were stained with CD66b/CD16b/CD14 and analyzed by flow cytometry. Resulting macrophage populations were regated on a forward versus side scatter plot to show the differential properties in size and granularity. In the given example, the proportion of small macrophages in the control donor is 4.9% (left) whereas the COPD patient shows an increase to 80.6% (right) of all macrophages. Shown is one example out of 11 for COPD and of 8 for controls donors. (B) Chemokine mRNA expression in controls and COPD. Purified sputum macrophages (>90%) from controls (left bar in each plot) and COPD patients (right bar) were analyzed by RT-PCR for mRNA expression for CCL2, CCL7, CCL13 and CCL22. Shown is the relative fold difference in expression of COPD patients as compared with controls that have been set as one. Values have been normalized to the expression of the house keeping gene α-enolase. Results were in fold difference 16.2 ± 20.9 for CCL2, 13.01 ± 8.2 for CCL7, 110 ± 225 for CCL13 and 12.3 ± 15.5 for CCL22. Shown are the mean values of 8 controls and 9–11 COPD patients. *P < 0.05, **P < 0.01, ***P < 0.001. The average percentage of small sputum macrophages in the two cohorts used for RT-PCR analysis was 12.9% ± 7.2% in controls and 85.9% ± 8.3% in COPD (P < 0.01).
Figure 2
Figure 2
(A) Proportion of sputum macrophages in controls and smokers. Shown are purified macrophages from induced sputum samples of a control donor (left plot) and a healthy smoker (right plot) in a forward versus side scatter analysis after staining with CD66b/CD16b/CD14. The percentage of small sputum macrophages in the control is 7% and 57.8% in the smoker. Shown is one example of four. The average percentage of small sputum macrophages in the two cohorts was 12.9% ± 7.2% in controls and 59.8% ± 15% in smokers (P < 0.02). (B) Chemokine mRNA expression in controls and healthy smokers. Purified sputum macrophages (>90%) from controls (left bar in each plot) and smokers (right bar) were analyzed by RT-PCR for mRNA expression for CCL2, CCL7, CCL13 and CCL22. Shown is the relative fold difference in expression of COPD patients as compared with controls that have been set as one. Values have been normalized to the expression of the house keeping gene α-enolase. Results are in fold difference 6.25 ± 3.6 for CCL2, 2.5 ± 1.5 for CCL7, 31.4 ± 24 for CCL13 and 23.3 ± 13.3 for CCL22. Shown are the mean values of 8 controls and 4 smokers. **P < 0.01, ***P < 0.001.
Figure 3
Figure 3
(A) Proportion of small sputum macrophages after LPS inhalation. Sputum induction was performed in healthy control donors 24 h before (left plot) and 24 h after (right plot) inhalation of 20 μg LPS. Sputum macrophages were purified by RosetteSep and regated in a forward versus side scatter plot after staining with CD66b/CD16b/CD14. Percentage of small sputum macrophages before LPS inhalation is 13.4% and 66.5% 24 h after inhalation. Shown is 1 out of 4 donors. The average percentage of small sputum macrophages was 18.3% ± 19.3% before and 63.7% ± 25.7 % after LPS inhalation (P < 0.05). (B) Chemokine expression before and after LPS inhalation. Macrophages from induced sputum were purified 24 h before and 24 h after LPS inhalation. RT-PCR was performed for CCL2, CCL7, CCL13 and CCL22. mRNA expression before LPS inhalation (left bars) was set as one and shown is the fold difference after LPS challenge (right bars). This was 6.5 ± 4.5 for CCL2, 3.2 ± 1.2 for CCL7, 0.3 ± 0.1 for CCL13 and 0.9 ± 0.4 for CCL22. Shown are the mean values from four donors. *P < 0.05 **P < 0.01 ***P < 0.001.
Figure 4
Figure 4
Chemokine protein in sputum in COPD and control donors. Supernatants from induced sputum samples were assessed by ELISA for CCL2, CCL7, CCL13 and CCL22 protein. Shown are the mean values in pg protein/mL in n = 8 controls (left bars) and in n = 5 COPD patients (right bars). *P < 0.05 for all proteins.

References

    1. Nicholas B, Djukanovic R. Induced sputum: a window to lung pathology. Biochem Soc Trans. 2009;37:868–72. - PubMed
    1. Traves SL, Culpitt SV, Russell RE, Barnes PJ, Donnelly LE. Increased levels of the chemokines GROalpha and MCP-1 in sputum samples from patients with COPD. Thorax. 2002;57:590–5. - PMC - PubMed
    1. Eickmeier O, et al. Sputum biomarker profiles in cystic fibrosis (CF) and chronic obstructive pulmonary disease (COPD) and association between pulmonary function. Cytokine. 2010;50:152–7. - PubMed
    1. Ilumets H, et al. Matrix metalloproteinases -8, -9 and -12 in smokers and patients with stage 0 COPD. Int J Chron Obstruct Pulmon Dis. 2007;2:369–79. - PMC - PubMed
    1. Rutgers SR, et al. Comparison of induced sputum with bronchial wash, bronchoalveolar lavage and bronchial biopsies in COPD. Eur Respir J. 2000;15:109–15. - PubMed

MeSH terms