. 2011 Feb;104(1-2):137-60.
doi: 10.1007/s00422-011-0424-z. Epub 2011 Feb 17.

Action understanding and active inference

Affiliations

Action understanding and active inference

Karl Friston et al. Biol Cybern. 2011 Feb.

Abstract

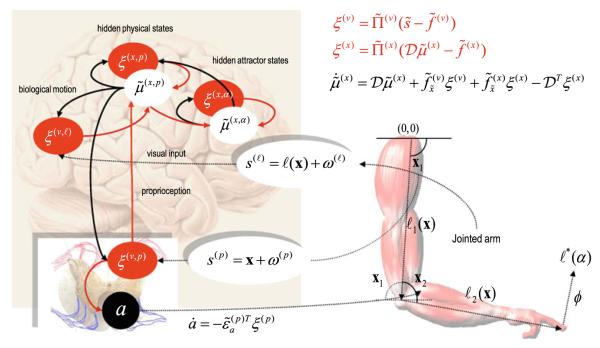
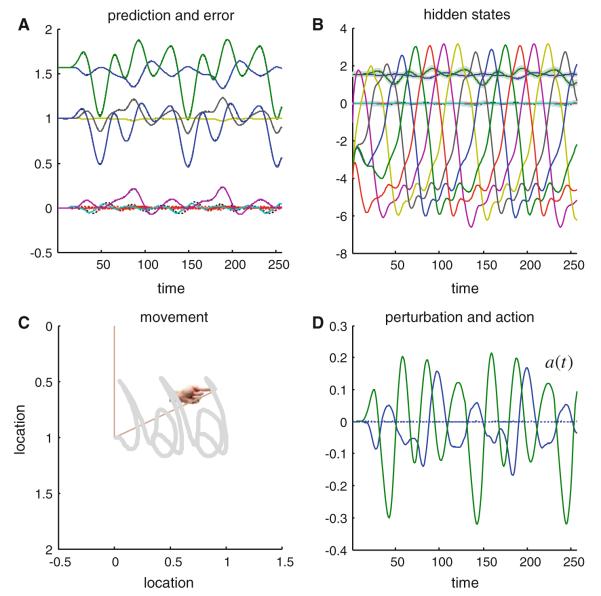
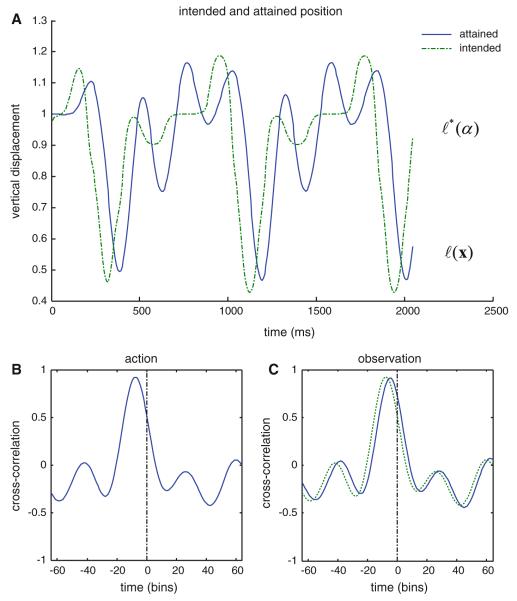
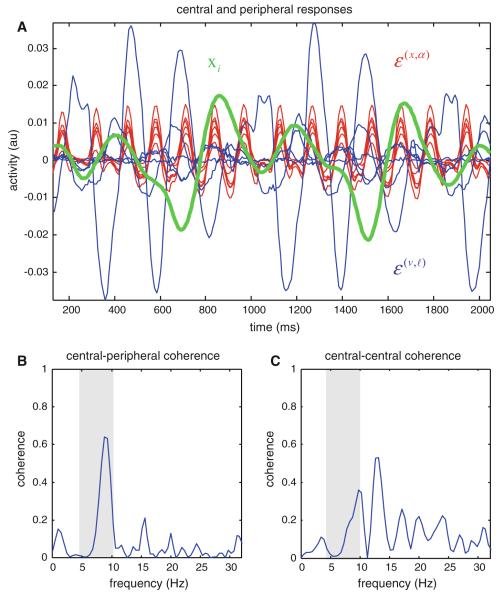
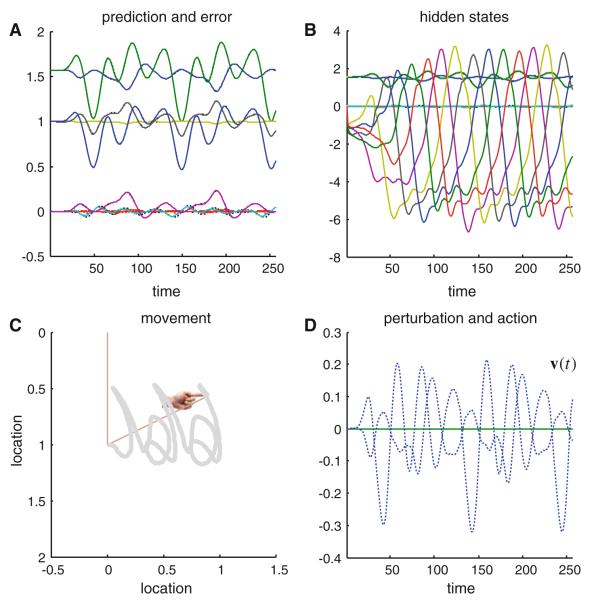
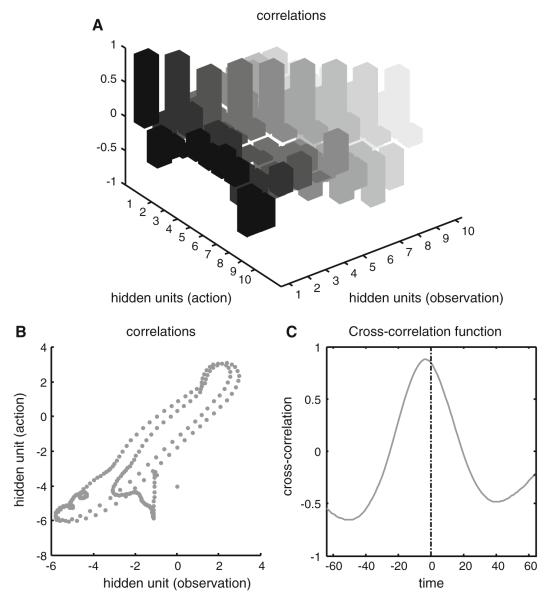
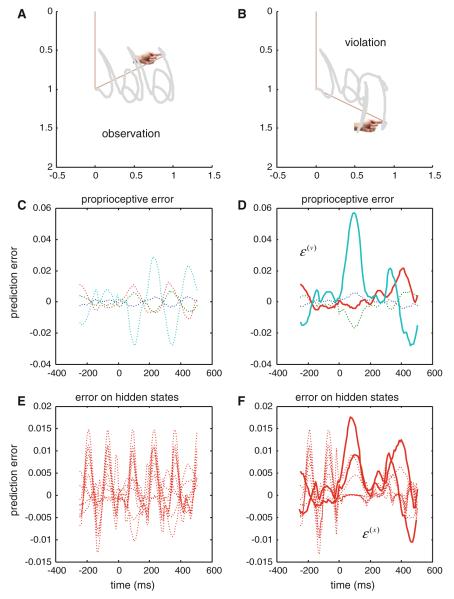
We have suggested that the mirror-neuron system might be usefully understood as implementing Bayes-optimal perception of actions emitted by oneself or others. To substantiate this claim, we present neuronal simulations that show the same representations can prescribe motor behavior and encode motor intentions during action-observation. These simulations are based on the free-energy formulation of active inference, which is formally related to predictive coding. In this scheme, (generalised) states of the world are represented as trajectories. When these states include motor trajectories they implicitly entail intentions (future motor states). Optimizing the representation of these intentions enables predictive coding in a prospective sense. Crucially, the same generative models used to make predictions can be deployed to predict the actions of self or others by simply changing the bias or precision (i.e. attention) afforded to proprioceptive signals. We illustrate these points using simulations of handwriting to illustrate neuronally plausible generation and recognition of itinerant (wandering) motor trajectories. We then use the same simulations to produce synthetic electrophysiological responses to violations of intentional expectations. Our results affirm that a Bayes-optimal approach provides a principled framework, which accommodates current thinking about the mirror-neuron system. Furthermore, it endorses the general formulation of action as active inference.


Figures

Fig. 1
Fig. 1
This schematic details the simulated mirror neuron system and the motor plant that it controls (left and right, respectively). The right panel depicts the functional architecture of the supposed neural circuits underlying active inference. The filled ellipses represent prediction error-units (neurons or populations), while the white ellipses denote state-units encoding conditional expectations about hidden states of the world. Here, they are divided into abstract attractor states (that supports stable heteroclinic orbits) and physical states of the arm (angular positions and velocities of the two joints). Filled arrows are forward connections conveying prediction errors and black arrows are backward connections mediating predictions. Motor commands are emitted by the black units in the ventral horn of the spinal cord. Note that these just receive prediction errors about proprioceptive states. These, in turn, are the difference between sensed proprioceptive input from the two joints and descending predictions from optimised representations in the motor cortex. The two jointed arm has a state space that is characterised by two angles, which control the position of the finger that will be used for writing in subsequent figures. The equations correspond to the expressions in the main text and represent a gradient decent on free-energy. They have been simplified here by omitting the hierarchical subscript and dynamics on hidden causes (which are not called on in this model)
Fig. 2
Fig. 2
This figure shows the results of simulated action (writing), under active inference, in terms of conditional expectations about hidden states of the world (b), consequent predictions about sensory input (a) and the ensuing behavior (c) that is caused by action (d). The autonomous dynamics that underlie this behavior rest upon the expected hidden states that follow Lotka–Volterra dynamics: these are the six (arbitrarily) colored lines in b. The hidden physical states have smaller amplitudes and map directly on to the predicted proprioceptive and visual signals (a). The visual locations of the two joints are shown as blue and green lines, above the predicted joint positions and angular velocities that fluctuate around zero. The dotted lines correspond to prediction error, which shows small fluctuations about the prediction. Action tries to suppress this error by ‘matching’ expected changes in angular velocity through exerting forces on the joints. These forces are shown in blue and green in d. The dotted line corresponds to exogenous forces, which were omitted in this example. The subsequent movement of the arm is traced out in c; this trajectory has been plotted in a moving frame of reference so that it looks like synthetic handwriting (e.g. a succession of ‘j’ and ‘a’ letters). The straight lines in c denote the final position of the two jointed arm and the hand icon shows the final position of its extremity. (Color figure online)
Fig. 3
Fig. 3
This figure illustrates how conditional expectations about hidden states of the world antedate and effectively prescribe subsequent behavior. a shows the intended position of the arms extremity. This is a nonlinear function of the attractor states (the expected states shown in Fig. 2). The subsequent position of the finger is shown as a solid line and roughly reproduces the expected position, with a lag of about 80ms. This lag can be seen more clearly in the cross-correlation function between the intended and attained positions shown in b. One can see that the peak correlation occurs at about 10 time bins or 80 ms prior to a zero lag. Exactly the same results are shown in c but here for action–observation (see Fig. 5). Crucially, the perceived attractor states (a perceptual representation of intention) are still expressed some 50-60ms before the subsequent trajectory or position is evident. Interestingly, there is a small shift in the phase relationship between the cross-correlation function under action (dotted line) and action observation (solid line). In other words, there is a slight (approximately 8 ms) delay under observation compared to action, in the cross-correlation between representations of intention and motor trajectories
Fig. 4
Fig. 4
a The activity of prediction error units (red attractor states, blue visual input) and the angular position of the first joint (green). These can be regarded as proxies for central and peripheral electrophysiological responses; b shows the coherence between the central (sum of errors on red attractor states) and peripheral (green arm movement) responses, while c shows the equivalent coherence between the two populations of (central red and blue) error-units. The main result here is that central to peripheral coherence lies predominantly in the theta range (4–10Hz; grey region), while the coherence between central measures lies predominately above this range. (Color figure online)
Fig. 5
Fig. 5
This shows exactly the same results as Fig. 2. However, in this simulation we used the forces from the action simulation to move the arm exogenously. Furthermore, we directed the agent’s attention away from proprioceptive inputs, by decreasing their precision to trivial values (a log precision of minus eight). From the agent’s point of view, it therefore sees exactly the same movements but in the absence of proprioceptive information. In other words, the sensory inputs produced by watching the movements of another agent. Because we initialised the expected attractor states to zero, sensory information has to entrain the hidden states so that they predict and model observed motor trajectories. The ensuing perceptual inference, under this simulated action observation, is almost indistinguishable from the inferred states of the world during action, once the movement trajectory and its temporal phase have been inferred correctly. Note that in these simulations the action is zero, while the exogenous perturbations are the same as the action in Fig. 2
Fig. 6
Fig. 6
These results illustrate the sensory or perceptual correlates of units representing expected hidden states. The left hand panels (a, c) show the activity of one (the fourth attractor) hidden state-unit under action, while the right panels (b, d) show exactly the same unit under action–observation. The top rows (a, b) show the trajectory in Cartesian (visual) space in terms of horizontal and vertical position (grey lines). The dots correspond to the time bins during which the activity of the state-unit exceeded an amplitude threshold of two arbitrary units. They key thing to take from these results is that the activity of this unit is very specific to a limited part of visual space and, crucially, a particular trajectory through this space. Notice that the same selectivity is shown almost identically under action and observation. The implicit direction selectivity can be seen more clearly in the lower panels (c, d), in which the same data are displayed but in a moving frame of reference to simulate writing. They key thing to note here is that this unit responds preferentially when, and only when, the motor trajectory produces a down-stroke, but not an up-stroke
Fig. 7
Fig. 7
This figure illustrates the correlations between representations of hidden states under action and observation. a The cross-correlation (at zero lag) between all ten hidden state-units. The first four correspond to the positions and velocities of the joint angles, while the subsequent six encode the attractor dynamics that represent movement trajectories during writing. The key thing to note here is that the leading diagonal of correlations is nearly one, while the off-diagonal terms are distributed about zero. This means that the stimulus (visual) input-dependent responses of these units are highly correlated under action and observation; and would be inferred, by an experimenter, to be representing the same thing. To provide a simpler illustration of these correlations, b plots the response of a single hidden state unit (the same depicted in the previous figure) under observation and action, respectively. The cross-correlation function is shown in c. Interestingly, there is a slight phase shift suggesting that under action the activity of this unit occurs slightly later (about 4-8ms)
Fig. 8
Fig. 8
This figure shows simulated electrophysiological responses to violations of expected movements. The top panels (a, b) show the stimuli presented to the agent as in Fig. 5. The lower panels show the synthetic electrophysiological responses of units reporting prediction error (c, d proprioceptive errors; e, f errors on the motion of hidden states). The left panels (a, c, e) show the stimuli and prediction errors under canonical or expected movements, whereas the right panels (b, d, f) show the same results with a violation. This violation was modeled by simply reversing the exogenous forces halfway through the writing. The exuberant production of prediction error is shown in d and e. It can be seen here that there is an early phasic and delayed components at about 100 and 400ms for at least one proprioceptive and hidden state error-unit (sold lines). In c and d, errors on the angular positions are show in blue and green, while errors on angular velocities are in red and cyan. All errors on hidden states are shown in red in e and f. (Color figure online)

References

    1. Afraimovich V, Tristan I, Huerta R, Rabinovich MI. Winnerless competition principle and prediction of the transient dynamics in a Lotka–Volterra model. Chaos. 2008;18(4):043103. - PubMed
    1. Allison T, Puce A, McCarthy G. Social perception from visual cues: role of the STS region. Trends Cogn Sci. 2000;4:267–278. - PubMed
    1. Arbib MA. From grasp to language: embodied concepts and the challenge of abstraction. J Physiol (Paris) 2008;102(1-3):4–20. - PubMed
    1. Arbib MA. Mirror system activity for action and language is embedded in the integration of dorsal and ventral pathways. Brain Lang. 2010;112(1):12–24. - PubMed
    1. Ballard DH, Hinton GE, Sejnowski TJ. Parallel visual computation. Nature. 1983;306:21–26. - PubMed

Publication types

LinkOut - more resources