

Targeted cell immobilization by ultrasound microbeam
- PMID: 21328319
- PMCID: PMC3098310
- DOI: 10.1002/bit.23073
Targeted cell immobilization by ultrasound microbeam
Abstract
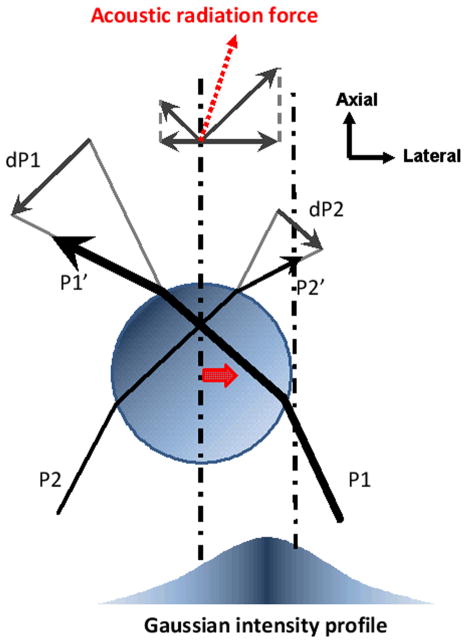
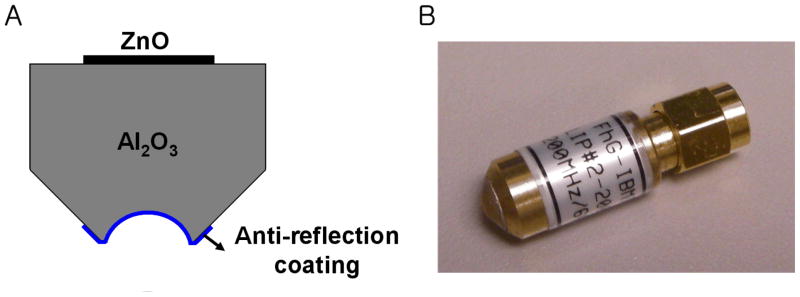
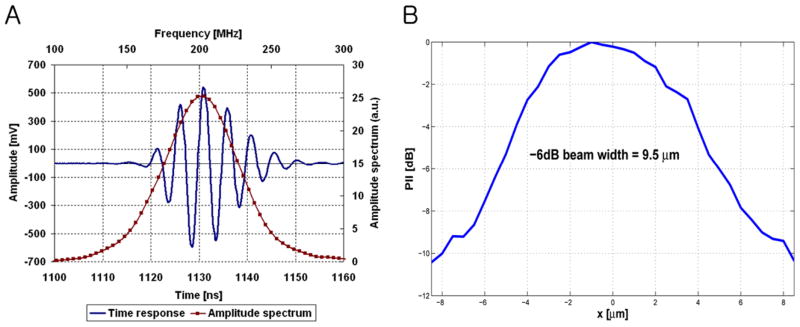
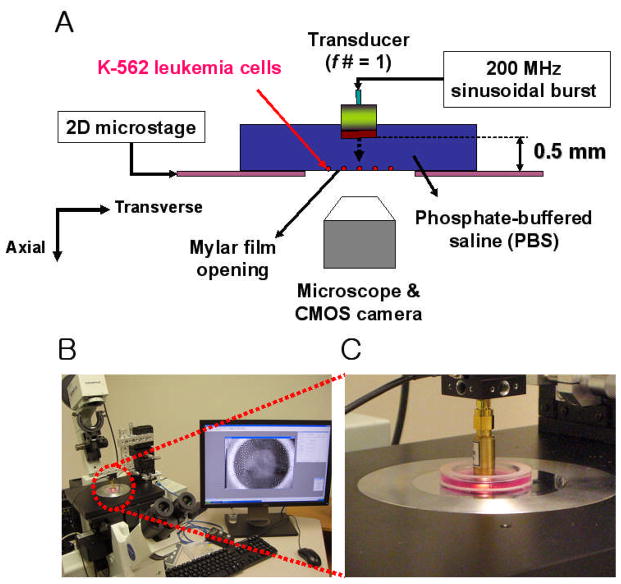
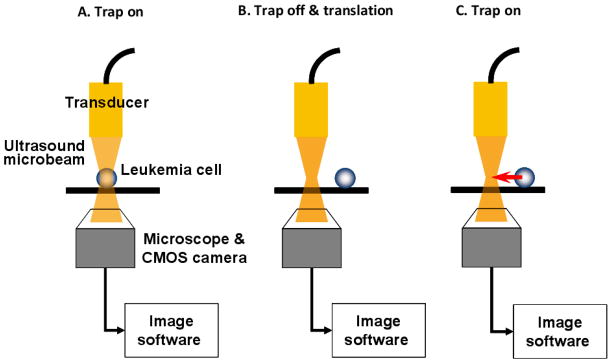
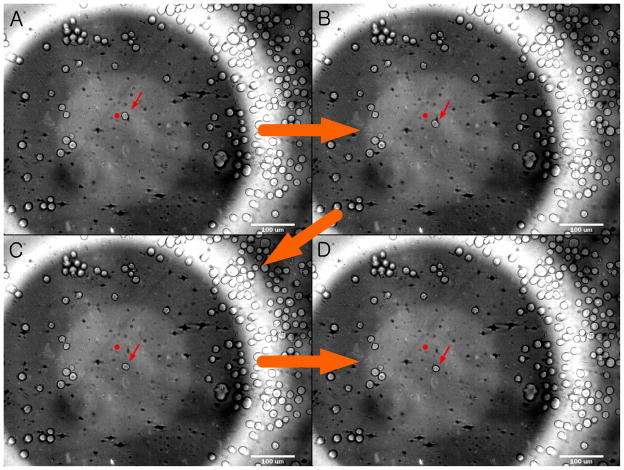
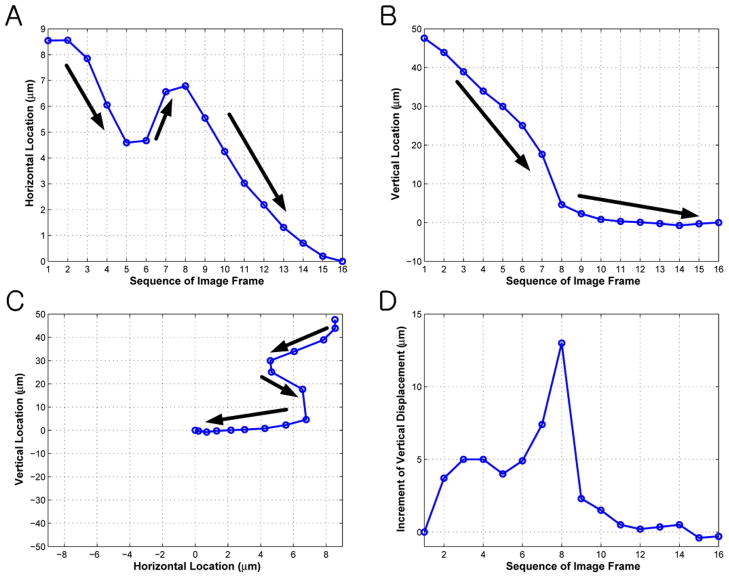
Various techniques exerting mechanical stress on cells have been developed to investigate cellular responses to externally controlled stimuli. Fundamental mechanotransduction processes about how applied physical forces are converted into biochemical signals have often been examined by transmitting such forces through cells and probing its pathway at cellular levels. In fact, many cellular biomechanics studies have been performed by trapping (or immobilizing) individual cells, either attached to solid substrates or suspended in liquid media. In that context, we demonstrated two-dimensional acoustic trapping, where a lipid droplet of 125 µm in diameter was directed transversely toward the focus (or the trap center) similar to that of optical tweezers. Under the influence of restoring forces created by a 30 MHz focused ultrasound beam, the trapped droplet behaved as if tethered to the focus by a linear spring. In order to apply this method to cellular manipulation in the Mie regime (cell diameter > wavelength), the availability of sound beams with its beamwidth approaching cell size is crucial. This can only be achieved at a frequency higher than 100 MHz. We define ultrasound beams in the frequency range from 100 MHz to a few GHz as ultrasound microbeams because the lateral beamwidth at the focus would be in the micron range. Hence a zinc oxide (ZnO) transducer that was designed and fabricated to transmit a 200 MHz focused sound beam was employed to immobilize a 10 µm human leukemia cell (K-562) within the trap. The cell was laterally displaced with respect to the trap center by mechanically translating the transducer over the focal plane. Both lateral displacement and position trajectory of the trapped cell were probed in a two-dimensional space, indicating that the retracting motion of these cells was similar to that of the lipid droplets at 30 MHz. The potential of this tool for studying cellular adhesion between white blood cells and endothelial cells was discussed, suggesting its capability as a single cell manipulator.
Copyright © 2011 Wiley Periodicals, Inc.
Figures
Similar articles
-
Numerical analysis for transverse microbead trapping using 30 MHz focused ultrasound in ray acoustics regime.Ultrasonics. 2014 Jan;54(1):11-9. doi: 10.1016/j.ultras.2013.06.002. Epub 2013 Jun 17. Ultrasonics. 2014. PMID: 23809757
-
Ultrahigh frequency lensless ultrasonic transducers for acoustic tweezers application.Biotechnol Bioeng. 2013 Mar;110(3):881-6. doi: 10.1002/bit.24735. Epub 2012 Oct 16. Biotechnol Bioeng. 2013. PMID: 23042219 Free PMC article.
-
A One-Sided Acoustic Trap for Cell Immobilization Using 30-MHz Array Transducer.IEEE Trans Ultrason Ferroelectr Freq Control. 2020 Jan;67(1):167-172. doi: 10.1109/TUFFC.2019.2940239. Epub 2019 Sep 10. IEEE Trans Ultrason Ferroelectr Freq Control. 2020. PMID: 31514129
-
Electric field-induced effects on neuronal cell biology accompanying dielectrophoretic trapping.Adv Anat Embryol Cell Biol. 2003;173:III-IX, 1-77. doi: 10.1007/978-3-642-55469-8. Adv Anat Embryol Cell Biol. 2003. PMID: 12901336 Review.
-
The study of cells by optical trapping and manipulation of living cells using infrared laser beams.ASGSB Bull. 1991 Jul;4(2):133-46. ASGSB Bull. 1991. PMID: 11537176 Review.
Cited by
-
Recent Advancements in High-Frequency Ultrasound Applications from Imaging to Microbeam Stimulation.Sensors (Basel). 2024 Oct 8;24(19):6471. doi: 10.3390/s24196471. Sensors (Basel). 2024. PMID: 39409511 Free PMC article. Review.
-
Non-contact multi-particle annular patterning and manipulation with ultrasound microbeam.Appl Phys Lett. 2014 Jun 16;104(24):244107. doi: 10.1063/1.4884938. Epub 2014 Jun 20. Appl Phys Lett. 2014. PMID: 25114330 Free PMC article.
-
An adjustable multi-scale single beam acoustic tweezers based on ultrahigh frequency ultrasonic transducer.Biotechnol Bioeng. 2017 Nov;114(11):2637-2647. doi: 10.1002/bit.26365. Epub 2017 Jul 18. Biotechnol Bioeng. 2017. PMID: 28654158 Free PMC article.
-
Fluorescence response of human HER2+ cancer- and MCF-12F normal cells to 200MHz ultrasound microbeam stimulation: a preliminary study of membrane permeability variation.Ultrasonics. 2012 Sep;52(7):803-8. doi: 10.1016/j.ultras.2012.03.002. Epub 2012 Mar 29. Ultrasonics. 2012. PMID: 22513260 Free PMC article.
-
On-chip manipulation of single microparticles, cells, and organisms using surface acoustic waves.Proc Natl Acad Sci U S A. 2012 Jul 10;109(28):11105-9. doi: 10.1073/pnas.1209288109. Epub 2012 Jun 25. Proc Natl Acad Sci U S A. 2012. PMID: 22733731 Free PMC article.
References
-
- Andersson H, Berg A. Microtechnologies and nanotechnologies for single-cell analysis. Curr Opin Biotech. 2004;15(1):44–49. - PubMed
-
- Applegate RW, Squier J, Vestad T, Oakey J, Marr DWM. Optical trapping, manipulation, and sorting of cells and colloids in microfluidic systems with diode laser bars. Opt Express. 2004;12:4390–4398. - PubMed
-
- Ashkin A, Dziedzic JM, Bjorkholm JM, Chu S. Observation of a single-beam gradient force optical trap for dielectric particles. Opt Lett. 1986;11:288–290. - PubMed
Publication types
MeSH terms
Grants and funding
LinkOut - more resources
Full Text Sources
Other Literature Sources
