Review
. 2011 Mar;15(3):173-82.
doi: 10.1089/omi.2010.0088. Epub 2011 Feb 17.

Stable isotope-resolved metabolomics (SIRM) in cancer research with clinical application to nonsmall cell lung cancer

Affiliations
Review

Stable isotope-resolved metabolomics (SIRM) in cancer research with clinical application to nonsmall cell lung cancer

Andrew N Lane et al. OMICS. 2011 Mar.

Abstract

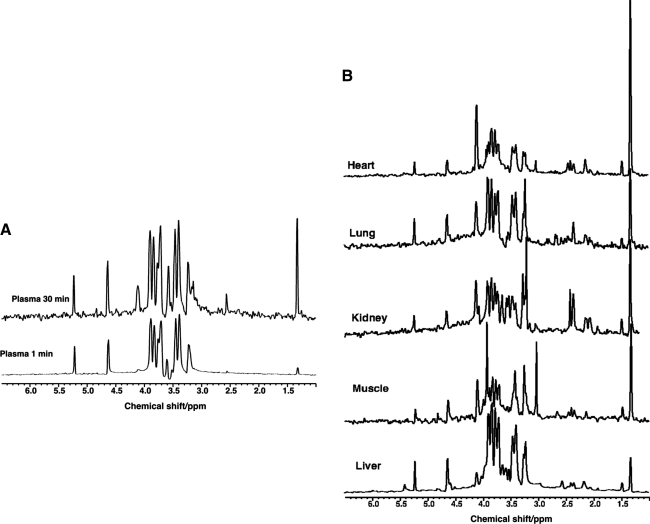
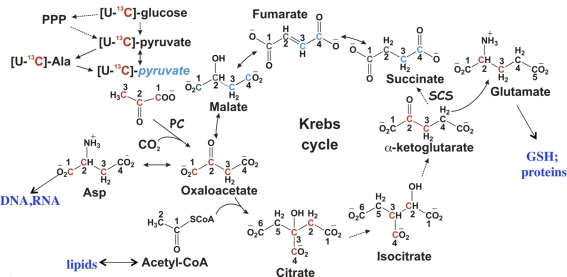
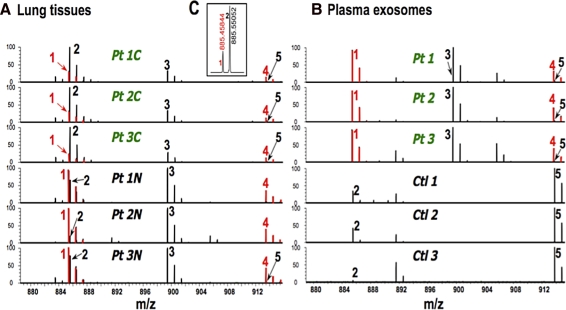
Metabolomics provides a readout of the state of metabolism in cells or tissue and their responses to external perturbations. For this reason, the approach has great potential in clinical diagnostics. Clinical metabolomics using stable isotope resolved metabolomics (SIRM) for pathway tracing represents an important new approach to obtaining metabolic parameters in human cancer subjects in situ. Here we provide an overview of the technology development of labeling from cells in culture and mouse models. The high throughput analytical methods NMR and mass spectrometry, especially Fourier transform ion cyclotron resonance, for analyzing the resulting metabolite isotopomers and isotopologues are described with examples of applications in cancer biology. Special technical considerations for clinical applications of metabolomics using stable isotope tracers are described. The whole process from concept to analysis will be exemplified by our on-going study of nonsmall cell lung cancer (NSCLC) metabolomics. This powerful new approach has already provided important new insights into metabolic adaptations in lung cancer cells, including the upregulation of anaplerosis via pyruvate carboxylation in NSCLC.


Figures

FIG.1.
FIG.1.
Simple metabolic scheme. G represents extracellular glucose, which is immediately phosphorylated by hexokinase to G6P in the cell. Laco and Laci represent extracellular (excreted) and intracellular lactate, respectively. The apparent rate constants, k, for metabolic transformations are functions of enzyme concentrations. In the limit of Michaelis-Menten kinetics, ki = (kcat/Km)iei[1−p/sKeq], where ei is the free enzyme concentration, p and s are the product and substrate concentrations catalyzed by the enzyme and Keq is the equilibrium constant for the reaction (Roberts et al., 1985).
FIG. 2.
FIG. 2.
Lactate production from 13C glucose and release into the medium was altered by different Se treatments. A549 cells were grown in RPMI containing 0.2% [U-13C]-glucose in the absence or presence of 5 μM methylseleninic acid (MSA), 6.25 μM selenite (SeO3), or 500 μM selenomethionine (SeM) for 24 h. Media metabolites were measured by 1D 1H NMR. Methyl region showing the central resonance of 1H attached to 12C and the two 13C satellites of lactate. The splitting pattern of the 13C satellites indicates the dominance of the uniformly 13C-labeled lactate isotopomer (13C3-lactate). MSA treatment caused a greater reduction in the release of 13C3-lactate than the other two Se treatments, relative to the control.
FIG. 3.
FIG. 3.
Time course of glucose consumption and lactate secretion into the medium. MDAMB231 cells were grown in RPMI containing 0.2% [U-13C]-glucose. Media metabolites were measured by 1D 1H NMR. (A) • 13C glucose; ▪ 13C Lac; □ 12C Lac; ○ valine. The continuous lines are regression fits to equations described in the text with specific growth rates (λ) of 0.07 h−1. R2 for glucose and 13C lactate were 0.996 and 0.998, respectively. The rate of change of valine was not significantly different form zero, and the rate of 13C lactate production was 0.01 mM h−1. (B) Fraction of 13C labeled lactate in the medium (○) and the fraction of 13C glucose consumed that was converted to excreted 13C lactate (•).
FIG. 4.
FIG. 4.
TOCSY Spectra: effect of 13C source. A549 cells were cultured in RPM1 containing either 10 mM [U-13C]-glucose + 2 mM 12C Gln or 10 mM 12C glucose + 2 mM [U-13C]-Gln. The cells were harvested and the polar metabolites were extracted. TOCSY spectra were recorded at 14.1 T and 293 K using an isotropic mixing time of 50 ms. (A) 13C glucose; (B) 13C Gln. Green boxes connect the 13C satellite peaks and red boxes trace the 1H covalent linkages of various metabolites.
FIG. 5.
FIG. 5.
Mouse U-13C glucose. SCID mice were injected with [U-13C]-glucose via the tail vein, and tissues were harvested 15 min later. 1H-{13C} HSQC spectra were recorded at 14.1 T 20°C. The spectra show the different relative labeling patterns of metabolites derived from glucose within 15 min. Left blood plasma at 1and 30 min showing mainly glucose (1 min) and glucose plus lactate (30 min). Right: tissues as shown on the figure.
FIG. 6.
FIG. 6.
Resecting a nonsmall cell lung tumor. Upper left: stapling the blood vessels; upper right: collection into an endo bag; middle left taking tumor tissue (white) and nontumor lung tissue from the excised lung; middle right: cutting tumor for pathology samples and freezing; lower left: freeze clamping tumor slice in liquid nitrogen; lower right: blotting tissue for pathology samples. The time between resection and freezing was <5 min.
FIG. 7.
FIG. 7.
Flow of 13C atoms from [U-13C]-glucose into detectable metabolites. 13C atoms from glucose (red) enter pyruvate and alanine by glycolysis, and then into Krebs cycle makers via the pyruvate dehydrogenase or pyruvate carboxylase reactions, and ultimately into macromolecules.
FIG. 8.
FIG. 8.
FT-ICR MS spectra. Lipids were solvent extracted from microvesicles of plasma and lung tissue, freeze dried, and redissolved in methanol. FT-ICR-MS spectra were recorded at 7 T on a Thermo LTQ-FT MS spectrometer by direct infusion. (A) Expanded region of the phospholipids extracted from normal and NSCLC tissue from three patients. (B) Lipids extracted from microvesicles obtained from the plasma of the same lung cancer patients and three control subjects (no history of cancer).

References

    1. Cancer Facts and Figures—2008. American Cancer Society; Boston, MA: ACS. (2008) pp. 1–72.
    1. Boyer M.J. Tannock I.F. Cellular and molecular basis of chemotherapy. In: Tannock I.F, editor; Hill R.P., editor. The Basic Science of Oncology. McGraw Hill; New York: 1998. pp. 350–369.
    1. Deberardinis R.J. Mancuso A. Daikhin E. Nissim I. Yudkoff M. Wehrli S., et al. Beyond aerobic glycolysis: transformed cells can engage in glutamine metabolism that exceeds the requirement for protein and nucleotide synthesis. Proc Natl Acad Sci USA. 2007;104:19345–19350. - PMC - PubMed
    1. Deberardinis R.J. Sayed N. Ditsworth D. Thompson C.B. Brick by brick: metabolism and tumor cell growth. Curr Opin Genet Dev. 2008;18:54–61. - PMC - PubMed
    1. Editorial. Early warnings. Nature. 2009;458:679–679. - PubMed

Publication types