Advancing the STMS genomic resources for defining new locations on the intraspecific genetic linkage map of chickpea (Cicer arietinum L.)
- PMID: 21329497
- PMCID: PMC3050819
- DOI: 10.1186/1471-2164-12-117
Advancing the STMS genomic resources for defining new locations on the intraspecific genetic linkage map of chickpea (Cicer arietinum L.)
Abstract
Background: Chickpea (Cicer arietinum L.) is an economically important cool season grain legume crop that is valued for its nutritive seeds having high protein content. However, several biotic and abiotic stresses and the low genetic variability in the chickpea genome have continuously hindered the chickpea molecular breeding programs. STMS (Sequence Tagged Microsatellite Sites) markers which are preferred for the construction of saturated linkage maps in several crop species, have also emerged as the most efficient and reliable source for detecting allelic diversity in chickpea. However, the number of STMS markers reported in chickpea is still limited and moreover exhibit low rates of both inter and intraspecific polymorphism, thereby limiting the positions of the SSR markers especially on the intraspecific linkage maps of chickpea. Hence, this study was undertaken with the aim of developing additional STMS markers and utilizing them for advancing the genetic linkage map of chickpea which would have applications in QTL identification, MAS and for de novo assembly of high throughput whole genome sequence data.
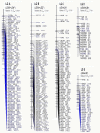
Results: A microsatellite enriched library of chickpea (enriched for (GT/CA)n and (GA/CT)n repeats) was constructed from which 387 putative microsatellite containing clones were identified. From these, 254 STMS primers were designed of which 181 were developed as functional markers. An intraspecific mapping population of chickpea, [ICCV-2 (single podded) × JG-62 (double podded)] and comprising of 126 RILs, was genotyped for mapping. Of the 522 chickpea STMS markers (including the double-podding trait, screened for parental polymorphism, 226 (43.3%) were polymorphic in the parents and were used to genotype the RILs. At a LOD score of 3.5, eight linkage groups defining the position of 138 markers were obtained that spanned 630.9 cM with an average marker density of 4.57 cM. Further, based on the common loci present between the current map and the previously published chickpea intraspecific map, integration of maps was performed which revealed improvement of marker density and saturation of the region in the vicinity of sfl (double-podding) gene thereby bringing about an advancement of the current map.
Conclusion: An arsenal of 181 new chickpea STMS markers was reported. The developed intraspecific linkage map defined map positions of 138 markers which included 101 new locations.Map integration with a previously published map was carried out which revealed an advanced map with improved density. This study is a major contribution towards providing advanced genomic resources which will facilitate chickpea geneticists and molecular breeders in developing superior genotypes with improved traits.
Figures


References
Publication types
MeSH terms
Substances
LinkOut - more resources
Full Text Sources
Miscellaneous

