. 2011 Apr 22;408(1):163-76.
doi: 10.1016/j.jmb.2011.02.021. Epub 2011 Feb 15.

Folding kinetics of the cooperatively folded subdomain of the IκBα ankyrin repeat domain

Affiliations

Folding kinetics of the cooperatively folded subdomain of the IκBα ankyrin repeat domain

Ingrid DeVries et al. J Mol Biol. .

Abstract

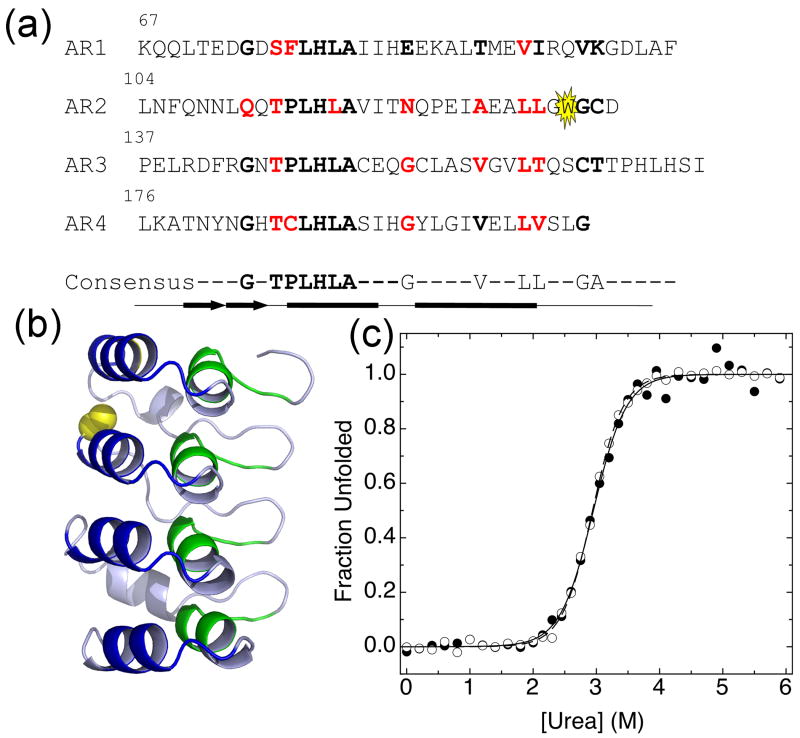
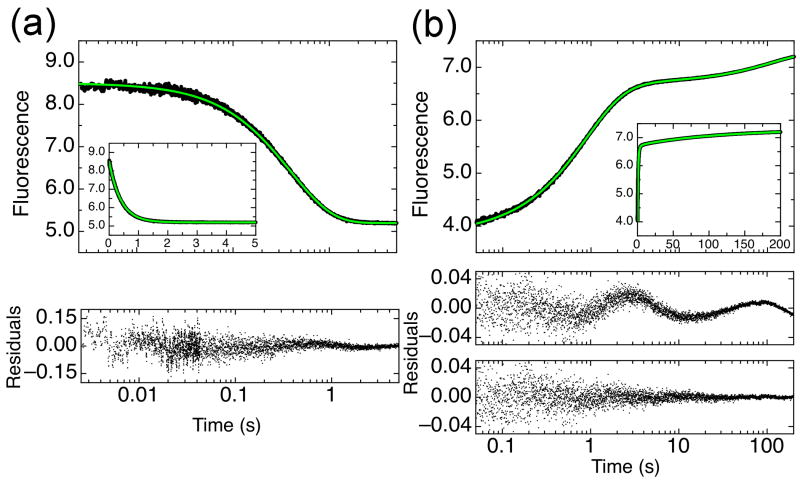
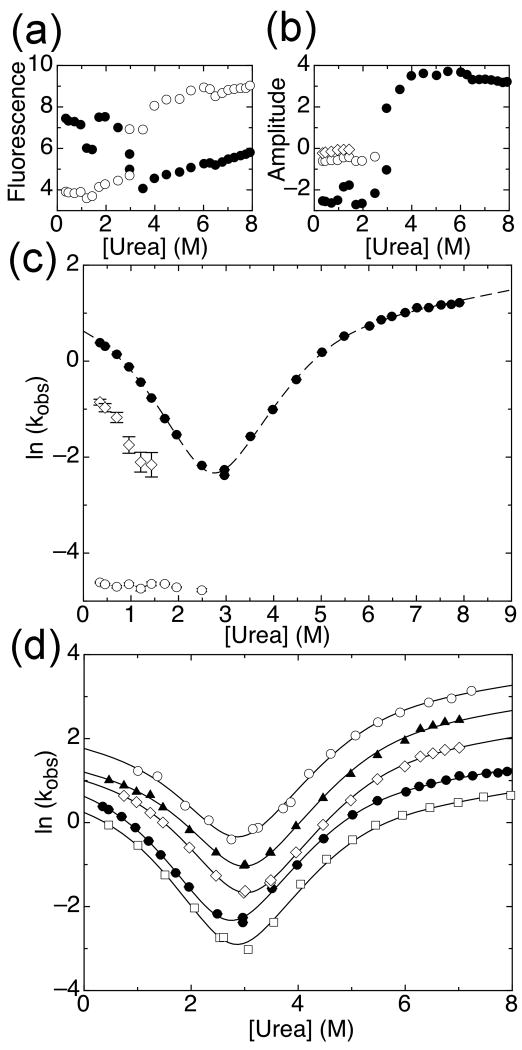
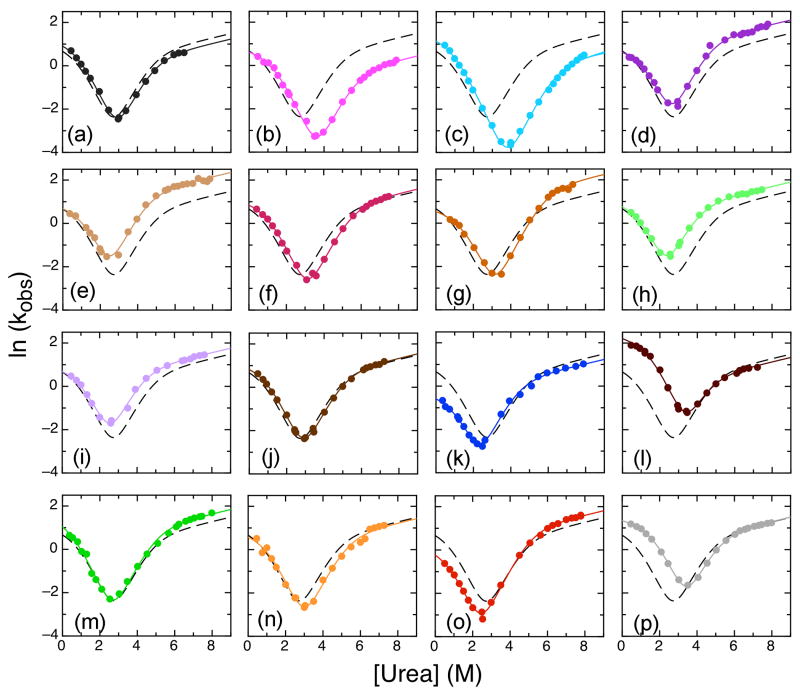
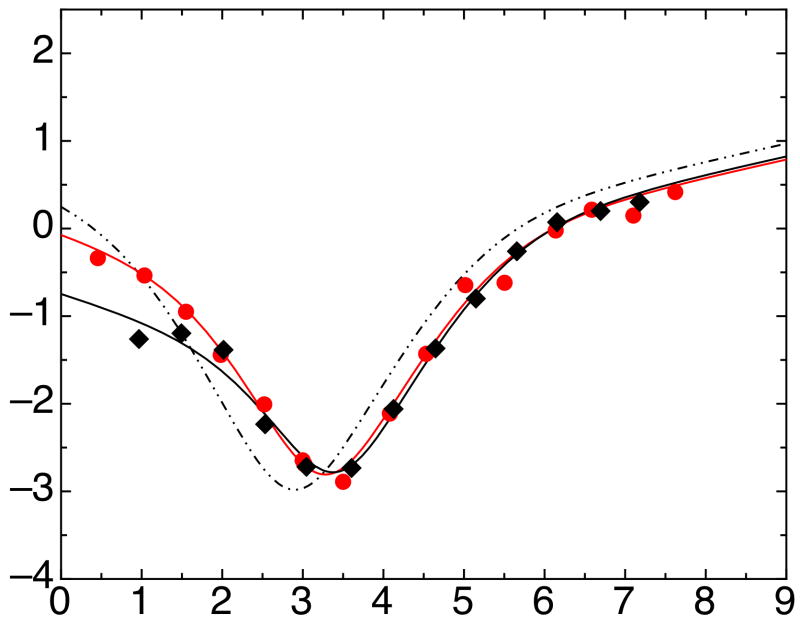
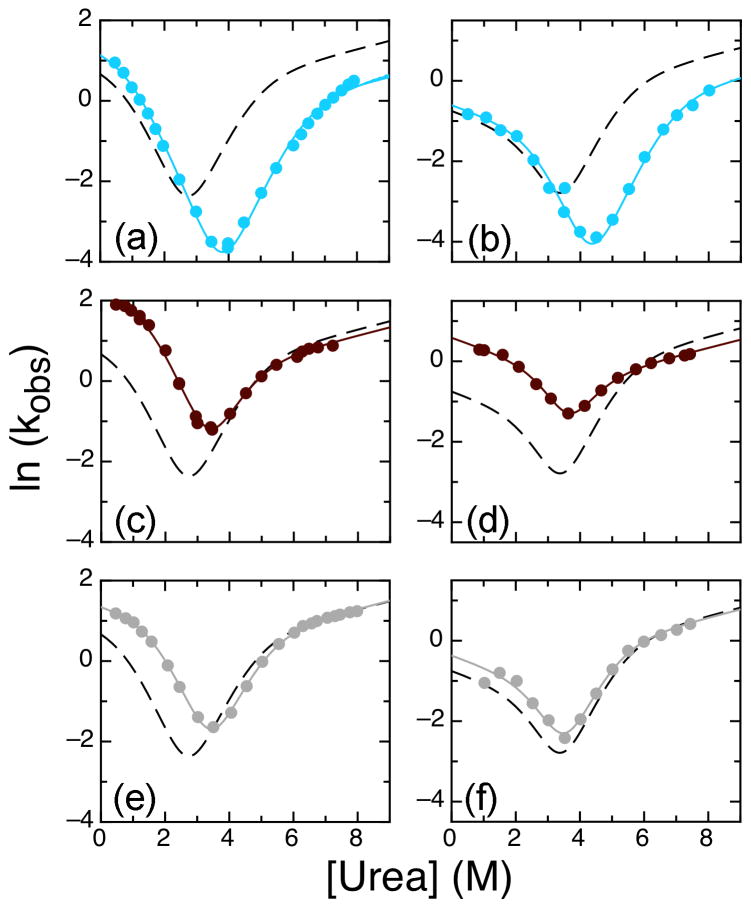
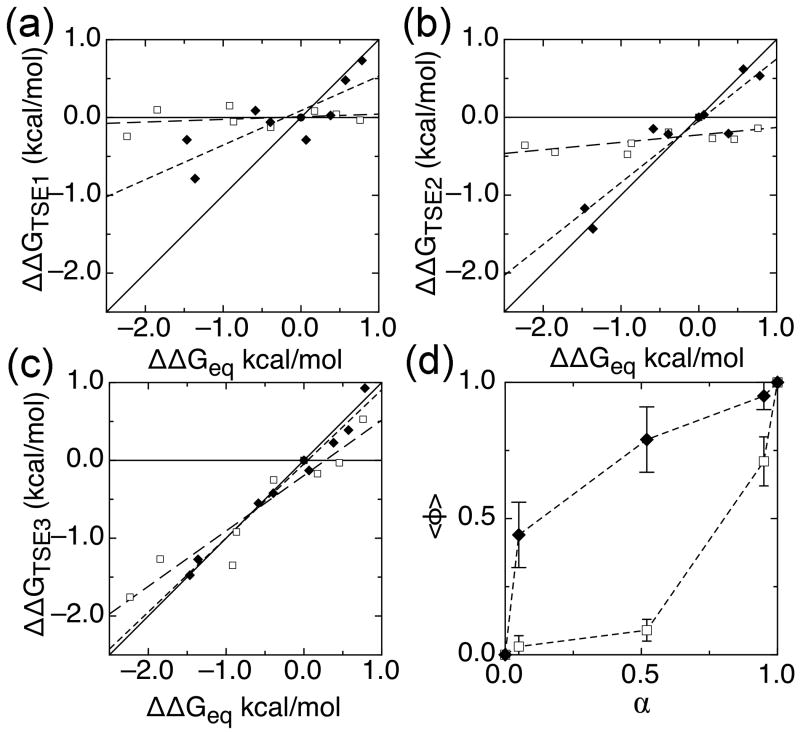
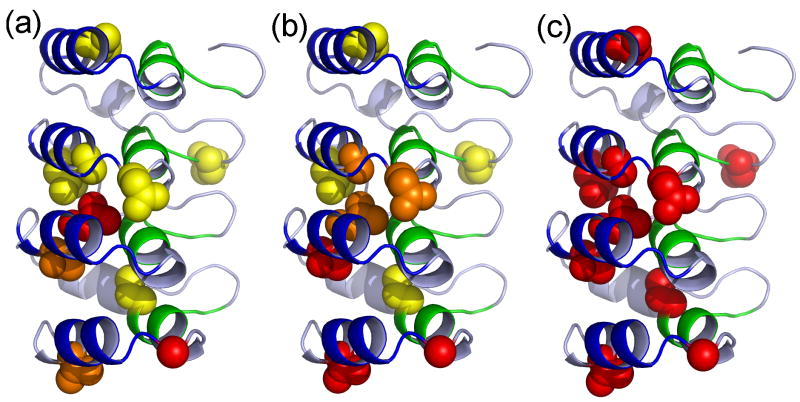
The ankyrin repeat (AR) domain of IκBα consists of a cooperative folding unit of roughly four ARs (AR1-AR4) and of two weakly folded repeats (AR5 and AR6). The kinetic folding mechanism of the cooperative subdomain, IκBα(67-206), was analyzed using rapid mixing techniques. Despite its apparent architectural simplicity, IκBα(67-206) displays complex folding kinetics, with two sequential on-pathway high-energy intermediates. The effect of mutations to or away from the consensus sequences of ARs on folding behavior was analyzed, particularly the GXTPLHLA motif, which have not been examined in detail previously. Mutations toward the consensus generally resulted in an increase in folding stability, whereas mutations away from the consensus resulted in decreased overall stability. We determined the free energy change upon mutation for three sequential transition state ensembles along the folding route for 16 mutants. We show that folding initiates with the formation of the interface of the outer helices of AR3 and AR4, and then proceeds to consolidate structure in these repeats. Subsequently, AR1 and AR2 fold in a concerted way in a single kinetic step. We show that this mechanism is robust to the presence of AR5 and AR6 as they do not strongly affect the folding kinetics. Overall, the protein appears to fold on a rather smooth energy landscape, where the folding mechanism conforms a one-dimensional approximation. However, we note that the AR does not necessarily act as a single folding element.


Figures

Figure 1
Figure 1
(a) The IκBα67-206W sequence with consensus positions in bold. Tryptophan reporter is highlighted in yellow. Mutated residues are shown in red. Secondary structure is shown below the sequence: the thick arrows represent a β-hairpin and the thick lines represent α-helices. The minimum consensus is represented below the sequence, with highly conserved residues shown and less conserved residues represented by dashes. (b) IκBα67-206W structure, from NF-κB/IκBα70-287 structure (PDB: 1NF1) . The backbone of the first consensus region encompassing the hairpin and the beginning of helix one is colored green and the backbone of the second consensus region encompassing helix two and the first part of the variable loop is colored blue. A133 is highlighted in yellow. Modifications were performed in PyMol . (c) Fraction unfolded from equilibrium urea denaturation of IκBα67-206W (3 μM), monitored by the CD signal at 225, closed circles, or fluorescence, open circles. Lines are from global fits of equilibrium denaturation curves at several temperatures to a two-state model with shared m-values (CD m-value is 2.06 kcal mol-1 M-1, fluorescence m-value is 2.12 kcal mol-1 M-1).
Figure 2
Figure 2
Refolding and unfolding traces for IκBα67-206W at 10°C, monitored by total fluorescence. Insets show the same data with linear time scale. (a) Folded IκBα67-206W was rapidly mixed to a final urea concentration of 6.5M and the change in fluorescence (of W133) was monitored (●). The unfolding trace was fit with a single exponential function (green line) with residuals shown below the plot. (b) IκBα67-206W, unfolded in 4M urea, was rapidly mixed to a final urea concentration of 0.7M (●). The refolding trace was fit with triple exponential function (green line), with residuals for a double or triple exponential function with residuals shown below for comparison.
Figure 3
Figure 3
Folding kinetics of IκBα67-206W. (a) Starting (open circles) and ending (closed circles) fluorescence signals for refolding and unfolding traces. (b) Amplitudes of refolding and unfolding phases: unfolding and main refolding phase (closed circles), slow refolding phase (open circles), intermediate refolding phase (open diamonds). (c) Effect of urea concentration on the observed folding or unfolding rate of IκBα67-206W at 10°C: unfolding and main refolding phase (closed circles), slow refolding phase (open circles), intermediate refolding phase (open diamonds). Line shows the fit of the data collected at 10°C from the global fit of several temperatures to a four-state model with shared m-values (m12 = -0.15 kcal mol-1 M-1, m21 = 0.96 kcal mol-1 M-1, m32 = 0.87 kcal mol-1 M-1, m43 = 0.11 kcal mol-1 M-1; m23 and m34 were set to 0 kcal mol-1 M-1). (d) Main refolding and unfolding phases for IκBα67-206W at 5°C (open squares), 10°C (closed circles, same as in (b) but shown for comparison), 15°C (open diamonds), 20°C (closed triangles), and 25°C (open circles). Lines shown are from the global fit described in (c).
Figure 4
Figure 4
Chevron plots for IκBα67-206W mutants showing observed unfolding and major refolding rates at 10°C. Lines shown are from the global fit of WT IκBα67-206W and all mutants to four-state model with shared m-values (m12 = -0.11 kcal mol-1 M-1, m21 = 0.98 kcal mol-1 M-1, m32 = 0.89 kcal mol-1 M-1, m43 = 0.11 kcal mol-1 M-1; m23 and m34 were set to 0 kcal mol-1 M-1). The WT IκBα67-206W fit is shown in all plots for comparison (black dashed line). Mutants shown are: (a) S76T/F77P (dark grey); (b) V93L (pink); (c) Q111G (cyan); (d) T113S (dark purple); (e) L117V (tan); (f) N122G (magenta); (g) A127V (brown); (h) L131V (light green); (i) T146S (light purple); (j) V160A (brown); (k) L163V (blue); (l) T164L (dark red); (m) T185S (green); (n) C186P (orange); (o) G194A (red); (p) V203L (light grey).
Figure 5
Figure 5
Chevron plots for IκBα67-287 A133W/W258F (red circles) and A133W (black triangles) showing main unfolding and refolding rates at 5°C. Solid lines show global fits of all six-AR mutants to a four-state model with shared m-values (m12 = -0.15 kcal mol-1 M-1, m21 = 0.96 kcal mol-1 M-1, m32 = 0.87 kcal mol-1 M-1, m43 = 0.11 kcal mol-1 M-1; m23 and m34 were set to 0 kcal mol-1 M-1). For comparison, the fit of four-AR IκBα67-206W (main phase at 5°C) to four-state model is shown as a dashed line.
Figure 6
Figure 6
Chevron plots for IκBα A133W mutants showing observed unfolding and refolding rates at 5°C (six-AR) and 10°C (four-AR). (a) Four-AR IκBα67-206 A133W Q111G, (b) six-AR IκBα67-287 A133W Q111G, (c) four-AR IκBα67-206 A133W T164L, (d) six-AR IκBα67-287 A133W T164L, (e) four-AR IκBα67-206 A133W V203L, (f) six-AR IκBα67-287 A133W V203L. Lines show global fits of all four-AR or six-AR mutants to a four-state model with shared m-values (as described in Figure 4 and Figure 5) of WT (dashed line) and mutants (solid lines). The color scheme for the individual mutations is the same as was used in Figure 4.
Figure 7
Figure 7
Leffler plots of ΔΔGTSE compared to ΔΔGequilibrium for IκBα67-206W mutants for (a) TSE 1, (b) TSE 2, and (c) TSE 3. AR 1 and 2 mutants (open squares) are shown with linear fits of these mutants (long-dashed lines), with slopes of 0.03, 0.07, and 0.70, corresponding to the average phi-values for AR 1 and 2 mutants in the three TSEs. AR 3 and 4 mutants (closed diamonds) are shown with linear fits of these mutants (short-dashed lines), with slopes of 0.45, 0.79, and 0.95, corresponding to average phi-values for AR 3 and 4 mutants in the three TSEs. For reference, solid lines of slope 0 and 1 are shown, corresponding to average phi-values of 0 and 1. (d) Average phi-value versus α, the location of each TSE along the reaction coordinate, for AR 1 and 2 mutants (closed circles) and AR 3 and 4 mutants (open circles). α was calculated globally as 0.05, 0.52, 0.95 for IκBα67-206W and 0.07, 0.35, 0.95 for IκBα67-287W from the kinetic m-values using the following equations: αTSE1=m12/meqαTSE2=(m12+m21)/meqαTSE3=(m12+m21+m34)/meq
Figure 8
Figure 8
Phi-values for (a) TSE 1, (b) TSE 2, and (c) TSE 3 are plotted on the structure of IκBα67-206W. The backbone of the protein is colored as in Figure 1. Mutated residues are shown in spheres and colored by Φ-value, with yellow for below 0.3, orange for 0.3 to 0.6, and red above 0.6, modifications performed in PyMol .

References

    1. Baeuerle PA, Baltimore D. I kappa B: a specific inhibitor of the NF-kappa B transcription factor. Science. 1988;242:540–6. - PubMed
    1. Croy CH, Bergqvist S, Huxford T, Ghosh G, Komives EA. Biophysical characterization of the free IkappaBalpha ankyrin repeat domain in solution. Protein Sci. 2004;13:1767–77. - PMC - PubMed
    1. Truhlar SM, Torpey JW, Komives EA. Regions of IkappaBalpha that are critical for its inhibition of NF-kappaB.DNA interaction fold upon binding to NF-kappaB. Proc Natl Acad Sci U S A. 2006;103:18951–6. - PMC - PubMed
    1. Ferreiro DU, Cervantes CF, Truhlar SM, Cho SS, Wolynes PG, Komives EA. Stabilizing IkappaBalpha by “consensus” design. J Mol Biol. 2007;365:1201–16. - PMC - PubMed
    1. Ferreiro DU, Cho SS, Komives EA, Wolynes PG. The energy landscape of modular repeat proteins: topology determines folding mechanism in the ankyrin family. J Mol Biol. 2005;354:679–92. - PubMed

Publication types