

Differentiation between glioblastomas, solitary brain metastases, and primary cerebral lymphomas using diffusion tensor and dynamic susceptibility contrast-enhanced MR imaging
- PMID: 21330399
- PMCID: PMC8013110
- DOI: 10.3174/ajnr.A2333
Differentiation between glioblastomas, solitary brain metastases, and primary cerebral lymphomas using diffusion tensor and dynamic susceptibility contrast-enhanced MR imaging
Abstract
Background and purpose: Glioblastomas, brain metastases, and PCLs may have similar enhancement patterns on MR imaging, making the differential diagnosis difficult or even impossible. The purpose of this study was to determine whether a combination of DTI and DSC can assist in the differentiation of glioblastomas, solitary brain metastases, and PCLs.
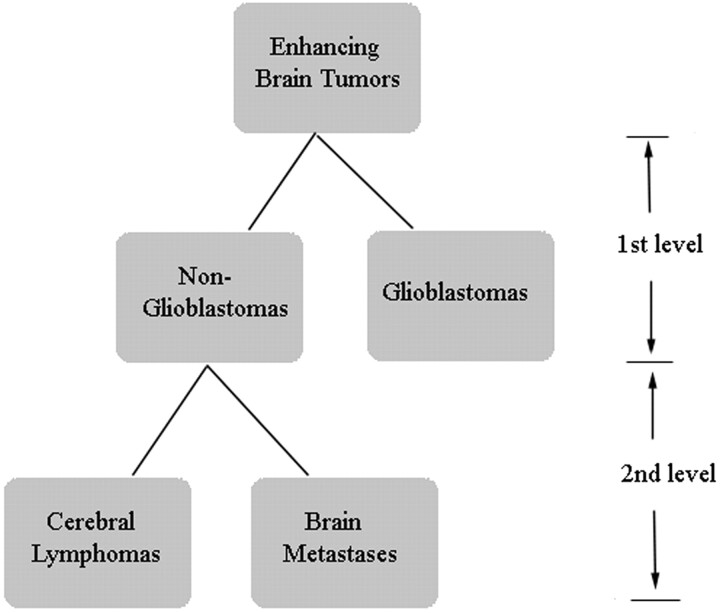
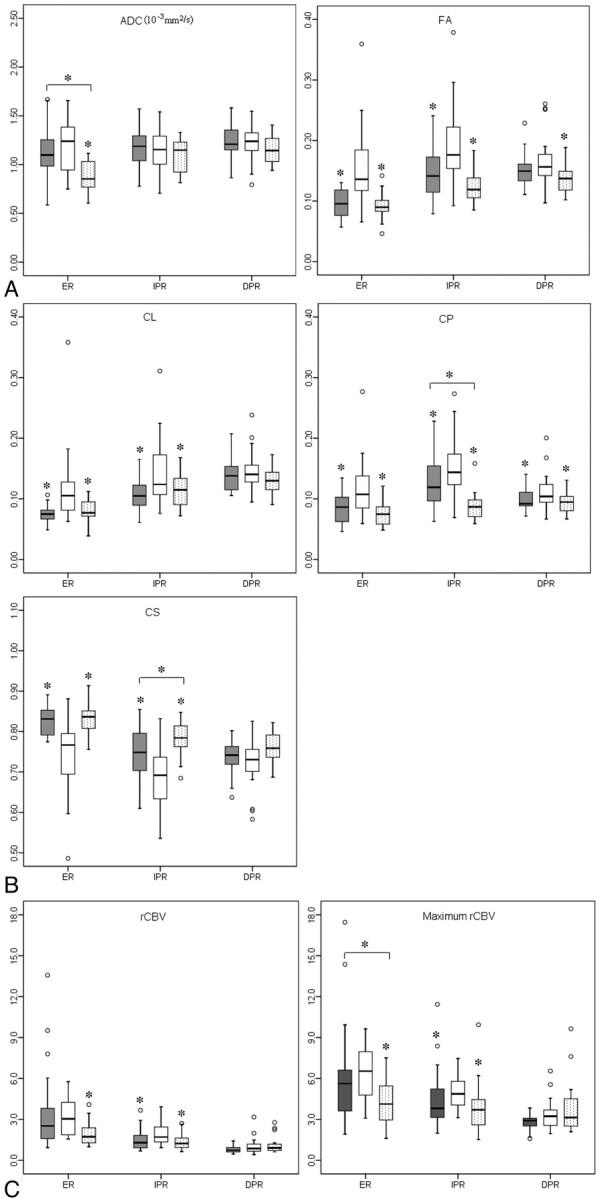
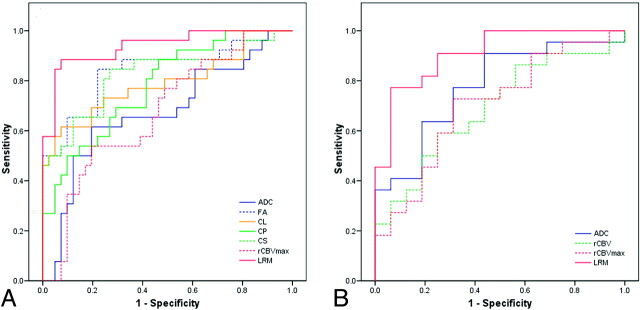
Materials and methods: Twenty-six glioblastomas, 25 brain metastases, and 16 PCLs were retrospectively identified. DTI metrics, including FA, ADC, CL, CP, CS, and rCBV were measured from the enhancing, immediate peritumoral and distant peritumoral regions. A 2-level decision tree was designed, and a multivariate logistic regression analysis was used at each level to determine the best model for classification.
Results: From the enhancing region, significantly elevated FA, CL, and CP and decreased CS values were observed in glioblastomas compared with brain metastases and PCLs (P < .001), whereas ADC, rCBV, and rCBV(max) values of glioblastomas were significantly higher than those of PCLs (P < .01). The best model to distinguish glioblastomas from nonglioblastomas consisted of ADC, CS (or FA) from the enhancing region, and rCBV from the immediate peritumoral region, resulting in AUC = 0.938. The best predictor to differentiate PCLs from brain metastases comprised ADC from the enhancing region and CP from the immediate peritumoral region with AUC = 0.909.
Conclusions: The combination of DTI metrics and rCBV measurement can help in the differentiation of glioblastomas from brain metastases and PCLs.
Figures


References
-
- Al-Okaili RN, Krejza J, Woo JH, et al. . Intraaxial brain masses: MR imaging-based diagnostic strategy—initial experience. Radiology 2007;243:539–50 - PubMed
-
- Batchelor T, Loeffler JS. Primary CNS lymphoma. J Clin Oncol 2006;24:1281–88 - PubMed
-
- Giese A, Westphal M. Treatment of malignant glioma: a problem beyond the margins of resection. J Cancer Res Clin Oncol 2001;127:217–25 - PubMed
-
- Soffietti R, Ruda R, Mutani R. Management of brain metastases. J Neurol 2002;249:1357–69 - PubMed
Publication types
MeSH terms
Substances
LinkOut - more resources
Full Text Sources
Medical
Miscellaneous