. 2011 Apr;25(4):564-74.
doi: 10.1210/me.2010-0425. Epub 2011 Feb 17.

Multiple sequence-specific DNA-binding proteins mediate estrogen receptor signaling through a tethering pathway

Affiliations

Multiple sequence-specific DNA-binding proteins mediate estrogen receptor signaling through a tethering pathway

Nina Heldring et al. Mol Endocrinol. 2011 Apr.

Abstract

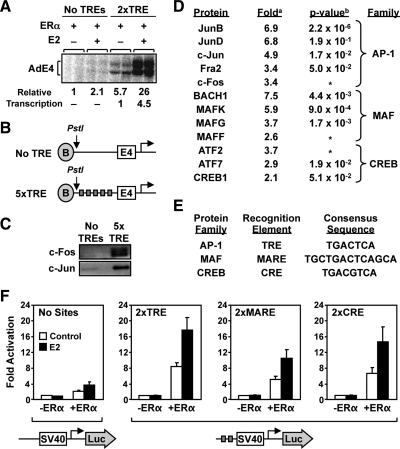
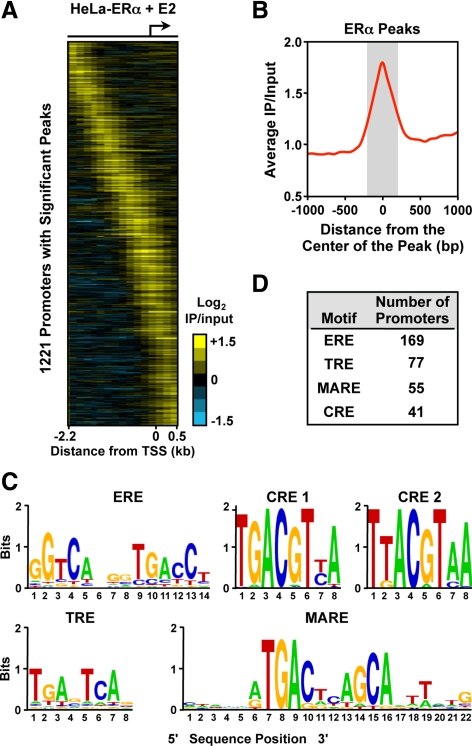
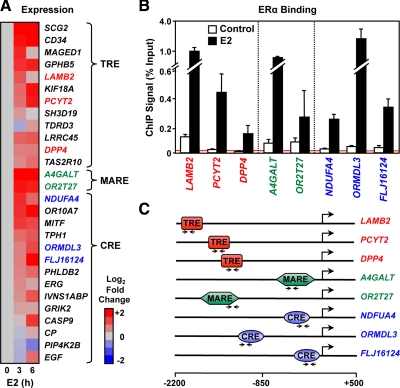
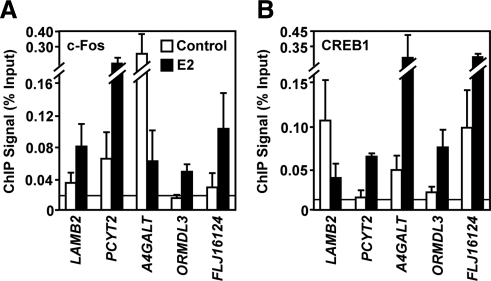
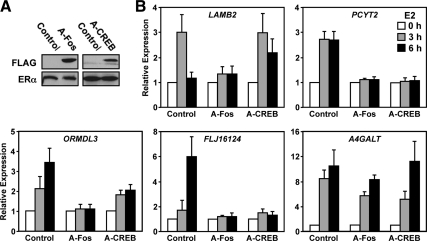
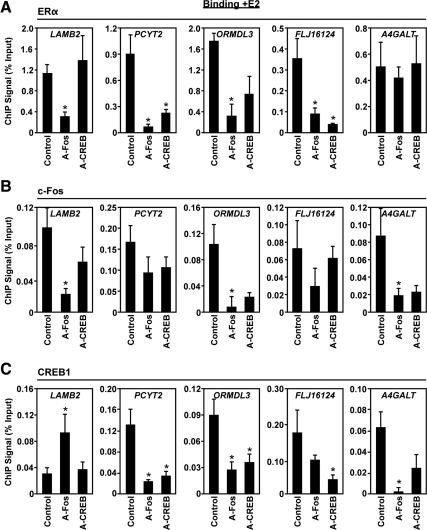
The indirect recruitment (tethering) of estrogen receptors (ERs) to DNA through other DNA-bound transcription factors (e.g. activator protein 1) is an important component of estrogen-signaling pathways, but our understanding of the mechanisms of ligand-dependent activation in this pathway is limited. Using proteomic, genomic, and gene-specific analyses, we demonstrate that a large repertoire of DNA-binding transcription factors contribute to estrogen signaling through the tethering pathway. In addition, we define a set of endogenous genes for which ERα tethering through activator protein 1 (e.g. c-Fos) and cAMP response element-binding protein family members mediates estrogen responsiveness. Finally, we show that functional interplay between c-Fos and cAMP response element-binding protein 1 contributes to estrogen-dependent regulation through the tethering pathway. Based on our results, we conclude that ERα recruitment in the tethering pathway is dependent on the ligand-induced formation of transcription factor complexes that involves interplay between the transcription factors from different protein families.


Figures

Fig. 1.
Fig. 1.
Proteomic analysis of TRE-binding proteins and their relationship to ERα-dependent gene regulation. A, ERα stimulates transcription through TREs in the presence of E2 in an in vitro assay with chromatin templates. Plasmid templates containing no TREs or two TRE sites upstream of the adenovirus E4 promoter were assembled into chromatin and transcribed in the presence of ERα and E2, as indicated, using HeLa cell nuclear extract as a source of the RNA polymerase II transcription machinery. B, Schematic diagrams of the immobilized templates used in the proteomic isolation of TRE-associated proteins. C, Western blot showing the presence of c-Fos and c-Jun in the bound fraction used for mass spectrometry analysis. Immobilized templates with or without five TREs were incubated with HeLa cell nuclear extract. Bound material was subjected to Western blotting using antibodies against c-Fos and c-Jun. D, List of bZip proteins identified in the TRE-bound fraction using iTRAQ. The bound proteins from panel C were subjected to iTRAQ analysis as described in Supplemental Materials and Methods. Those proteins with greater than or equal to 2-fold enrichment were included in the list. a, Average iTRAQ117/iTRAQ114 ratio for all unique peptides corresponding to the listed protein. b, P value calculated in ProteinPilot software using the fold ratios for multiple peptides from the same protein. *, P value not determined because the fold ratio was based on single unique/unambiguous peptide sequence. E, Comparison of the consensus response elements for the AP-1, MAF, and CREB families. F, ERα + E2 stimulates gene expression in HeLa cells through TREs, MAREs, and CREs. The results shown are from transient transfection-reporter gene assays with SV40-luciferase reporter constructs lacking or containing two TREs, MAREs, or CREs sites upstream of the promoter (see schematics along bottom). Each reporter was transfected together with or without an expression vector for ERα into HeLa cells, followed by treatment ± E2 (100 nm) for 16 h. The cells were collected and subjected to luciferase assay analyses. The results are presented as fold over the −ERα/−E2 condition. Each bar represents the mean ± sem (n ≥ 3).
Fig. 2.
Fig. 2.
Analysis of TREs, CREs, MAREs, and EREs in promoter-proximal ERα-binding sites in HeLa-ERα cells. A, Analysis of promoter-proximal ERα-binding sites in HeLa-ERα cells by ChIP-chip using Nimblegen promoter arrays containing approximately 19,000 promoters tiled from 2200 bp upstream to 500 bp downstream of the TSS. The data are shown as a heat map of the log2 ERα + E2 ChIP-chip data for 1221 promoters with significant binding. B, Metagene analysis of the log2 enrichment ratios from regions in panel A showing significant ERα binding. The probe signals from all significant and unique ERα-binding sites were centered on the peak and averaged across the regions. C, Sequences generated from the TRE, CRE, MARE, and ERE position weight matrices used in the bioinformatic analysis of the significant and unique ERα-binding site peaks. The sequences are shown as web logos. The TRE, CRE, and MARE position weight matrices are from TRANSFAC (58). The ERE position weight matrix was generated based on information from O'Lone et al. (60). D, Bioinformatic analysis of TREs, CREs, MAREs, and EREs under the significant and unique ERα-binding site peaks in HeLa-ERα cells. The position weight matrices from panel C were used with MAST (34) to map the location of the binding sites. The number of promoters with a significant peak of ERα and containing a TRE, CRE, MARE, or an ERE are indicated. IP, Immunoprecipitation.
Fig. 3.
Fig. 3.
E2-dependent regulation of ERα-bound genes lacking EREs. A, Heat map of RT-qPCR expression data for E2-regulated genes from HeLa-ERα cells presented as log2 fold ratio and separated into three classes based on the tethering protein-binding site. The cells were treated ± E2 (100 nm) as indicated. B, ChIP-qPCR analysis of the E2-dependent ERα binding to the promoters of a subset of the genes shown in panel A. Each bar represents the mean ± sem (n ≥ 3). C, Schematics of the promoters analyzed in panel B showing the enhancer element type and its location relative to the TSS. Arrow pairs indicate the location of the primers used for qPCR.
Fig. 4.
Fig. 4.
E2-dependent modulation of c-Fos and CREB1 binding at ERα-bound promoters that lack EREs. ChIP-qPCR analysis of c-Fos (A) and CREB1 (B) binding in HeLa-ERα cells to the promoters of a subset of the genes shown in Fig. 3A. The cells were treated ± E2 (100 nm) for 45 min. Each bar represents the mean ± sem (n ≥ 3).
Fig. 5.
Fig. 5.
Inhibition of E2-dependent TRE- and CRE-reporter gene activity with DN c-Fos or CREB1. A, Schematic diagram of DN inhibitor effects on c-Fos and CREB1 binding, and ERα recruitment. B, Western blot showing the expression of A-Fos and A-CREB in transfected HeLa cells vs. an empty vector control. Poly(ADP-ribose) polymerase (PARP-1) was used as a loading control. C, Effects of A-Fos and A-CREB on E2-dependent TRE- and CRE-reporter gene activity in HeLa cells. SV40-luciferase reporter constructs lacking or containing two TREs or CREs were transfected with an expression vector for ERα into HeLa cells, followed by treatment ± E2 (100 nm) for 16 h. The cells were collected and subjected to luciferase assay analyses. The results are presented as fold over the control/−E2 condition. Each bar represents the mean ± sem (n ≥ 3). TF, Transcription factor.
Fig. 6.
Fig. 6.
Inhibition of E2-dependent expression of native TRE- and CRE-containing genes with DN c-Fos or CREB1. A, Western blot showing the stable expression of A-Fos, A-CREB, and ERα in HeLa-ERα cells vs. an empty vector control. ERα was used as a loading control. B, mRNA expression analyses by RT-qPCR in control, A-Fos, and A-CREB HeLa-ERα cells in response to 0, 3, and 6 h of E2 treatment (100 nm) as indicated. The data presented as fold over the 0 h E2 condition in each cell line. Each bar represents the mean ± sem (n ≥ 3).
Fig. 7.
Fig. 7.
Inhibition of ERα, c-Fos, and CREB1 binding to the promoters of native TRE- and CRE-containing genes with DN c-Fos or CREB1. ChIP-qPCR analysis of ERα (A), c-Fos (B), and CREB1 (C) binding in control, A-Fos, and A-CREB HeLa-ERα cells to the promoters of a subset of the genes shown in Fig. 3A. The cells were treated ± E2 (100 nm) for 45 min. Each bar represents the mean ± sem (n ≥ 3). Bars marked with an asterisk are significantly different from the control (P < 0.05).

References

    1. Heldring N, Pike A, Andersson S, Matthews J, Cheng G, Hartman J, Tujague M, Ström A, Treuter E, Warner M, Gustafsson JA. 2007. Estrogen receptors: how do they signal and what are their targets. Physiol Rev 87:905–931 - PubMed
    1. McDevitt MA, Glidewell-Kenney C, Jimenez MA, Ahearn PC, Weiss J, Jameson JL, Levine JE. 2008. New insights into the classical and non-classical actions of estrogen: evidence from estrogen receptor knock-out and knock-in mice. Mol Cell Endocrinol 290:24–30 - PMC - PubMed
    1. Jakacka M, Ito M, Martinson F, Ishikawa T, Lee EJ, Jameson JL. 2002. An estrogen receptor (ER)α deoxyribonucleic acid-binding domain knock-in mutation provides evidence for nonclassical ER pathway signaling in vivo. Mol Endocrinol 16:2188–2201 - PubMed
    1. O'Brien JE, Peterson TJ, Tong MH, Lee EJ, Pfaff LE, Hewitt SC, Korach KS, Weiss J, Jameson JL. 2006. Estrogen-induced proliferation of uterine epithelial cells is independent of estrogen receptor α binding to classical estrogen response elements. J Biol Chem 281:26683–26692 - PubMed
    1. Syed FA, Mödder UI, Fraser DG, Spelsberg TC, Rosen CJ, Krust A, Chambon P, Jameson JL, Khosla S. 2005. Skeletal effects of estrogen are mediated by opposing actions of classical and nonclassical estrogen receptor pathways. J Bone Miner Res 20:1992–2001 - PMC - PubMed

Publication types

MeSH terms

Substances