. 2011 Feb 18;331(6019):920-4.
doi: 10.1126/science.1198878.

Classic selective sweeps were rare in recent human evolution

Affiliations

Classic selective sweeps were rare in recent human evolution

Ryan D Hernandez et al. Science. .

Abstract

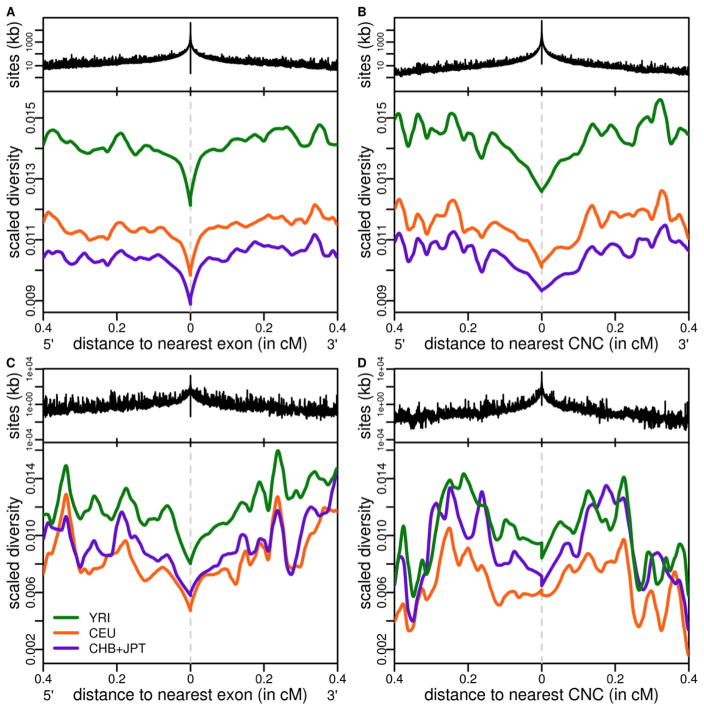
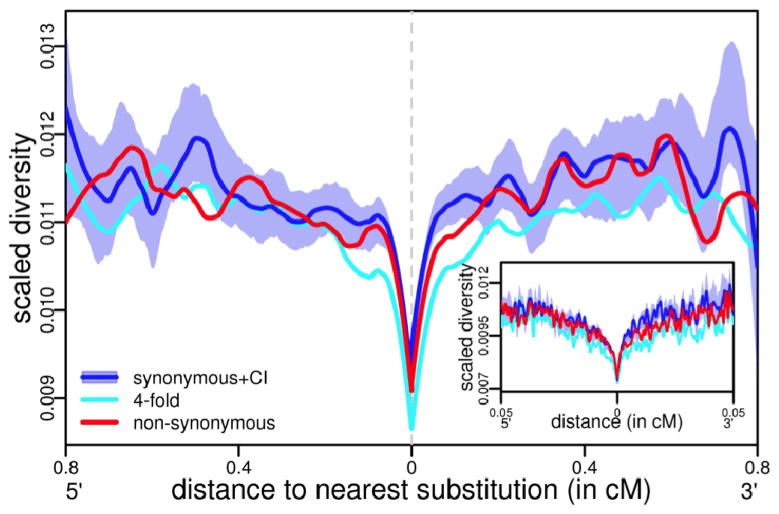
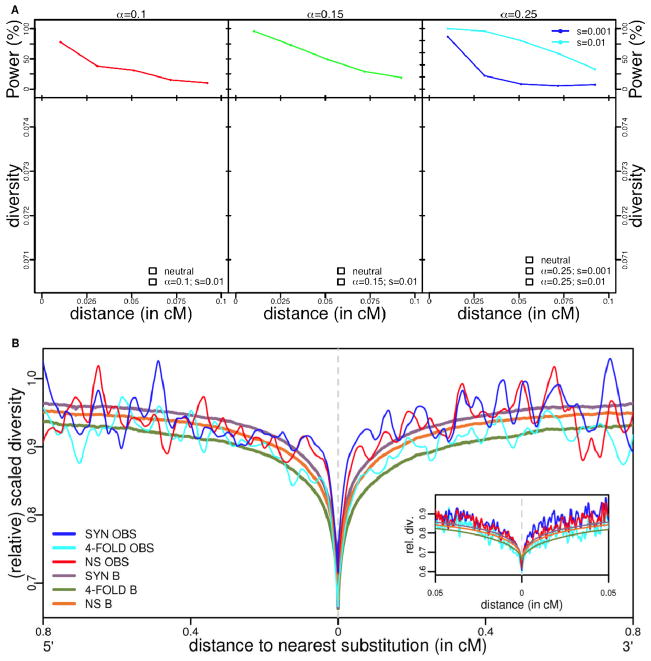
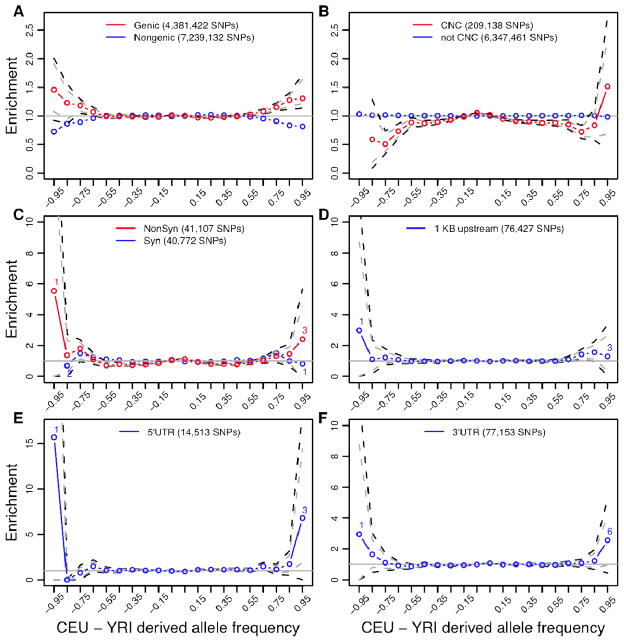
Efforts to identify the genetic basis of human adaptations from polymorphism data have sought footprints of "classic selective sweeps" (in which a beneficial mutation arises and rapidly fixes in the population).Yet it remains unknown whether this form of natural selection was common in our evolution. We examined the evidence for classic sweeps in resequencing data from 179 human genomes. As expected under a recurrent-sweep model, we found that diversity levels decrease near exons and conserved noncoding regions. In contrast to expectation, however, the trough in diversity around human-specific amino acid substitutions is no more pronounced than around synonymous substitutions. Moreover, relative to the genome background, amino acid and putative regulatory sites are not significantly enriched in alleles that are highly differentiated between populations. These findings indicate that classic sweeps were not a dominant mode of human adaptation over the past ~250,000 years.


Figures

Figure 1
Figure 1
Diversity levels divided by human-rhesus macaque divergence (at non-conserved, non-coding sites), as a function of genetic distance from exons and conserved non-coding regions. The top row (A–B) is for autosomes and the bottom row (C–D) for the X. Shown are LOESS curves obtained for a span of 0.1 and a bin size of 1.2×10⁻⁵ cM. Above each figure is a histogram of the number of kilobases in each bin (plotted on a log scale). See (20)for alternative versions.
Figure 2
Figure 2
Diversity levels divided by human-rhesus macaque divergence around human-specific substitutions across the autosomes. In the main plot, LOESS curves have a span of 0.2 and a bin size of 1.2×10⁻⁵ cM; the inset has a span of 0.05 to show added detail near the substitutions. The light blue shaded area represents the central 95%-tile of diversity estimates obtained from 100 bootstrap simulations. For alternative versions of this figure, including the same plot for YRI and CHB+JPT, as well as the X chromosome see Fig. S5.
Figure 3
Figure 3
A. The power to detect a decrease in diversity levels around amino acid substitutions due to classic sweeps. The top panel presents the power at a given genetic distance from the substitution, for the three sets of selection parameters (see (20)). The bottom panel shows the diversity patterns expected around amino acid substitutions for four sets of selection parameters, as well as for a model of purely neutral fixations, after LOESS smoothing (with a span of 0.2). For each set of parameters, the shaded area represents the central 95%-tile obtained from 100 bootstrap simulations. The depth of the trough reflects the fraction of substitutions that were beneficial and its width the typical strength of selection (24). B. Relative diversity levels around non-synonymous, synonymous and four fold degenerate synonymous substitutions predicted under a model of background selection(see (20)). B is the predicted diversity level relative to what is expected with no effects of background selection, i.e., under strict neutrality, taking into account variation in mutation rates (11). OBS is the observed value of average scaled diversity (i.e., diversity divided by divergence to rhesus macaque). For the expected diversity around exons and CNCs, as well as predictions for the X chromosome, see Fig. S8.
Figure 4
Figure 4
A. Enrichment of highly differentiated SNPs in genic compared to non-genic sites. Shown is the CEU-YRI comparison (other population comparisons are in Fig. S9A). The total number of SNPs considered in each pairwise comparison is provided in the legend of each plot. Central 90% and 98% confidence intervals are shown with gray and black dashed lines, respectively; they were obtained by bootstrapping 200 kb regions 1000 times (16). B. Enrichment of highly differentiated SNPs in conserved non-coding compared to non-conserved, non-coding positions (20), for the CEU-YRI comparison. Other population comparisons are in Fig. S9B. C–F. Enrichment of specific genic annotations relative to the genomic background showing the central 90% and 98% confidence intervals for the CEU-YRI comparison with gray and black dashed lines, respectively. Note that an enrichment of 0 corresponds to no SNPs with that level of differentiation, so the confidence interval is not estimated in this case. Other population comparisons are shown in Fig. S10. For the numbers of each bin, see Fig. S11. Enrichments calculated on the folded frequency spectrum are shown in Fig. S13B. For a comparison of synonymous and non-synonymous SNPs in an alternative resequencing dataset, see Fig. S14.

Comment in

Similar articles

Cited by

References

    1. Sabeti PC, et al. Science. 2006 Jun 16;312:1614. - PubMed
    1. Akey JM. Genome Res. 2009 May;19:711. - PMC - PubMed
    1. Maynard Smith JM, Haigh J. Genet Res. 1974 Feb;23:23. - PubMed
    1. Przeworski M. Genetics. 2002 Mar;160:1179. - PMC - PubMed
    1. Williamson SH, et al. PLoS Genet. 2007 Jun;3:e90. - PMC - PubMed

Publication types

Substances