

Climate forcing due to optimization of maximal leaf conductance in subtropical vegetation under rising CO2
- PMID: 21330553
- PMCID: PMC3053960
- DOI: 10.1073/pnas.1100555108
Climate forcing due to optimization of maximal leaf conductance in subtropical vegetation under rising CO2
Abstract
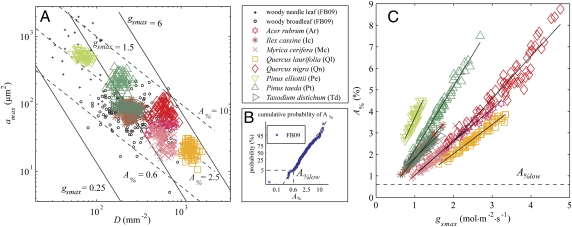
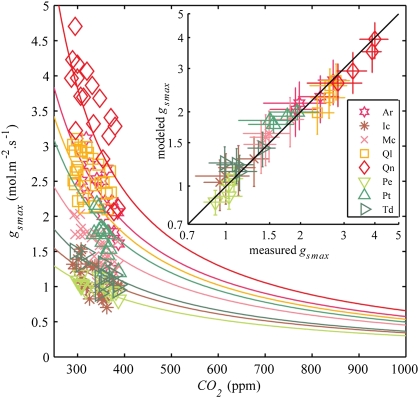
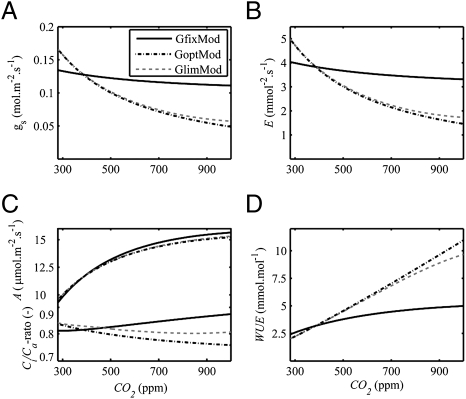
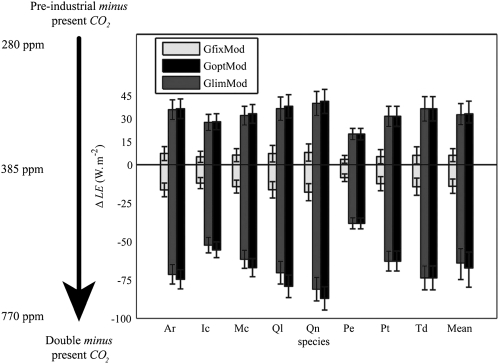
Plant physiological adaptation to the global rise in atmospheric CO(2) concentration (CO(2)) is identified as a crucial climatic forcing. To optimize functioning under rising CO(2), plants reduce the diffusive stomatal conductance of their leaves (g(s)) dynamically by closing stomata and structurally by growing leaves with altered stomatal densities and pore sizes. The structural adaptations reduce maximal stomatal conductance (g(smax)) and constrain the dynamic responses of g(s). Here, we develop and validate models that simulate structural stomatal adaptations based on diffusion of CO(2) and water vapor through stomata, photosynthesis, and optimization of carbon gain under the constraint of a plant physiological cost of water loss. We propose that the ongoing optimization of g(smax) is eventually limited by species-specific limits to phenotypic plasticity. Our model reproduces observed structural stomatal adaptations and predicts that adaptation will continue beyond double CO(2). Owing to their distinct stomatal dimensions, angiosperms reach their phenotypic response limits on average at 740 ppm and conifers on average at 1,250 ppm CO(2). Further, our simulations predict that doubling today's CO(2) will decrease the annual transpiration flux of subtropical vegetation in Florida by ≈60 W·m(-2). We conclude that plant adaptation to rising CO(2) is altering the freshwater cycle and climate and will continue to do so throughout this century.
Conflict of interest statement
The authors declare no conflict of interest.
Figures
Comment in
-
Stomatal numbers, leaf and canopy conductance, and the control of transpiration.Proc Natl Acad Sci U S A. 2011 Jul 12;108(28):E275; author reply E276. doi: 10.1073/pnas.1105831108. Epub 2011 Jun 23. Proc Natl Acad Sci U S A. 2011. PMID: 21700887 Free PMC article. No abstract available.
References
-
- Trewavas A. What is plant behaviour? Plant Cell Environ. 2009;32:606–616. - PubMed
-
- Hetherington AM, Woodward FI. The role of stomata in sensing and driving environmental change. Nature. 2003;424:901–908. - PubMed
-
- Cowan IR, Farquhar GD. Stomatal function in relation to leaf metabolism and environment. Symp Soc Exp Biol. 1977;31:471–505. - PubMed
-
- Beerling DJ, Franks PJ. Plant science: The hidden cost of transpiration. Nature. 2010;464:495–496. - PubMed
-
- Darwin F. Observations on stomata. Proc R Soc Lond. 1898;63:413–417.
Publication types
MeSH terms
Substances
LinkOut - more resources
Full Text Sources
