

Social network analysis of patient sharing among hospitals in Orange County, California
- PMID: 21330578
- PMCID: PMC3052345
- DOI: 10.2105/AJPH.2010.202754
Social network analysis of patient sharing among hospitals in Orange County, California
Erratum in
- Am J Public Health. 2011 Oct;101(10):1815
Abstract
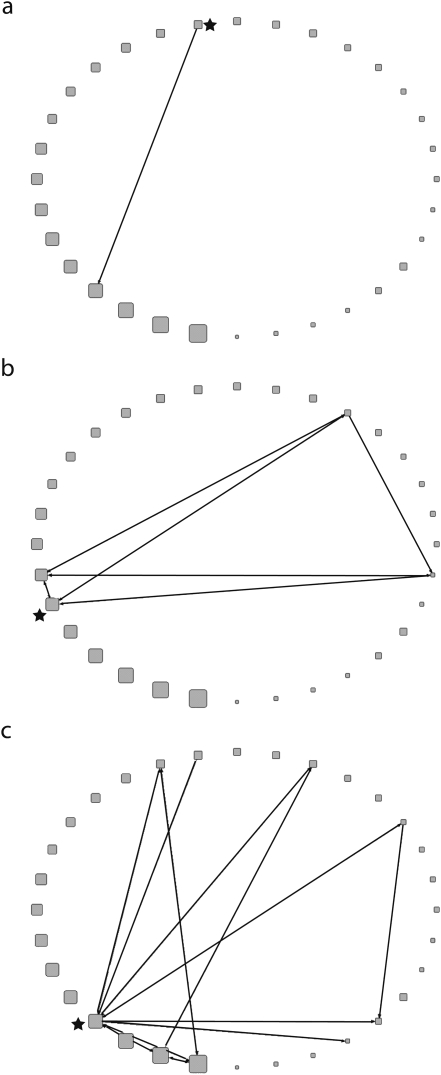
Objectives: We applied social network analyses to determine how hospitals within Orange County, California, are interconnected by patient sharing, a system which may have numerous public health implications.
Methods: Our analyses considered 2 general patient-sharing networks: uninterrupted patient sharing (UPS; i.e., direct interhospital transfers) and total patient sharing (TPS; i.e., all interhospital patient sharing, including patients with intervening nonhospital stays). We considered these networks at 3 thresholds of patient sharing: at least 1, at least 10, and at least 100 patients shared.
Results: Geographically proximate hospitals were somewhat more likely to share patients, but many hospitals shared patients with distant hospitals. Number of patient admissions and percentage of cancer patients were associated with greater connectivity across the system. The TPS network revealed numerous connections not seen in the UPS network, meaning that direct transfers only accounted for a fraction of total patient sharing.
Conclusions: Our analysis demonstrated that Orange County's 32 hospitals were highly and heterogeneously interconnected by patient sharing. Different hospital populations had different levels of influence over the patient-sharing network.
Figures

References
-
- Haley RW, Hightower AW, Kabbaz RG, et al. The emergence of methicillin-resistant Staphyoloccus aureus infections in United States hospitals. Ann Intern Med. 1982;97(3):297–308 - PubMed
-
- Pittet D. Infection control and quality health care in the new millenium. Am J Infect Control. 2005;33(5):258–267 - PubMed
-
- Page D. Patient care: spread of infectious diseases may run high with patient sharing. Hosp Health Netw. 2009;83(9):12 - PubMed
-
- Dube C, Ribble C, Kelton D, McNab B. A review of network analysis terminology and its application to foot-and-mouth disease modelling and policy development. Transbound Emerg Dis. 2009;56(3):73–85 - PubMed
