

Challenges to developing proteomic-based breast cancer diagnostics
- PMID: 21332380
- PMCID: PMC3128487
- DOI: 10.1089/omi.2010.0120
Challenges to developing proteomic-based breast cancer diagnostics
Abstract
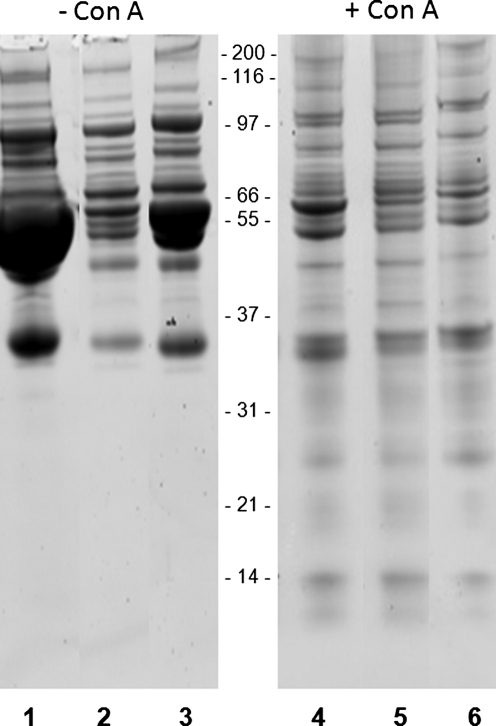
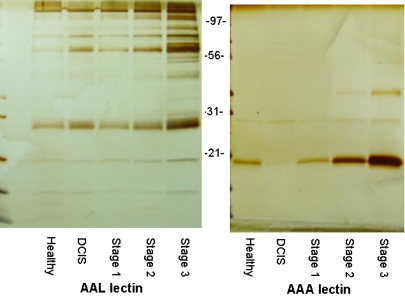
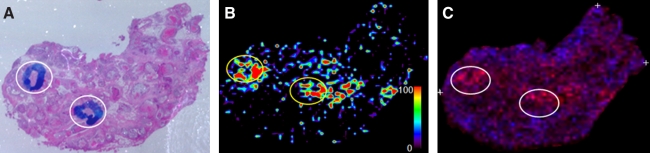
Over the past decade, multiple genetic and histological approaches have accelerated development of new breast cancer diagnostics and treatment paradigms. Multiple distinct genetic subtypes of breast cancers have been defined, and this has progressively led toward more personalized medicine in regard to treatment options. There still remains a deficiency in the development of molecular diagnostic assays that can be used for breast cancer detection and pretherapy clinical decisions. In particular, the type of cancer-specific biomarker typified by a serum or tissue-derived protein. Progress in this regard has been minimal, especially in comparison to the rapid advancements in genetic and histological assays for breast cancers. In this review, some potential reasons for this large gap in developing protein biomarkers will be discussed, as well as new strategies for improving these approaches. Improvements in the study design of protein biomarker discovery strategies in relation to the genetic subtypes and histology of breast cancers is also emphasized. The current successes in use of genetic and histological assays for breast cancer diagnostics are summarized, and in that context, the current limitations of the types of breast cancer-related clinical samples available for protein biomarker assay development are discussed. Based on these limitations, research strategies emphasizing identification of glycoprotein biomarkers in blood and MALDI mass spectrometry imaging of tissues are described.
Figures
References
-
- Anderson N.L. Anderson N.G. The human plasma proteome: history, character, and diagnostic prospects. Mol. Cell Proteomics. 2002;1:845–867. - PubMed
-
- Bauer K. Brown M. Cress R. Parise C.A. Caggiano V. Descriptive analysis of estrogen receptor (ER)-negative, progesterone receptor (PR)-negative, and HER2-negative invasive breast cancer, the so-called triplenegative phenotype: a population-based study from the california cancer registry. Cancer. 2007;109:1721–1728. - PubMed
-
- Bauer J.A. Chakravarthy A.B. Rosenbluth J.M. Mi D. Seeley E.H. De Matos Granja-Ingram N., et al. Identification of markers of taxane sensitivity using proteomic and genomic analyses of breast tumors from patients receiving neoadjuvant paclitaxel and radiation. Clin. Cancer Res. 2010;16:681–690. - PMC - PubMed
-
- Carey L.A. Perou C.M. Livasy C.A. Dressler L.G. Cowan D. Conway K., et al. Race, breast cancer subtypes, and survival in the carolina breast cancer study. JAMA. 2006;295:2492–2502. - PubMed
Publication types
MeSH terms
Substances
Grants and funding
LinkOut - more resources
Full Text Sources
Medical
Miscellaneous
