Comparative Study
. 2011 May-Jun;87(3):690-8.
doi: 10.1111/j.1751-1097.2011.00911.x. Epub 2011 Mar 9.

Animal models of acute photodamage: comparisons of anatomic, cellular and molecular responses in C57BL/6J, SKH1 and Balb/c mice

Affiliations
Comparative Study

Animal models of acute photodamage: comparisons of anatomic, cellular and molecular responses in C57BL/6J, SKH1 and Balb/c mice

Meena R Sharma et al. Photochem Photobiol. 2011 May-Jun.

Abstract

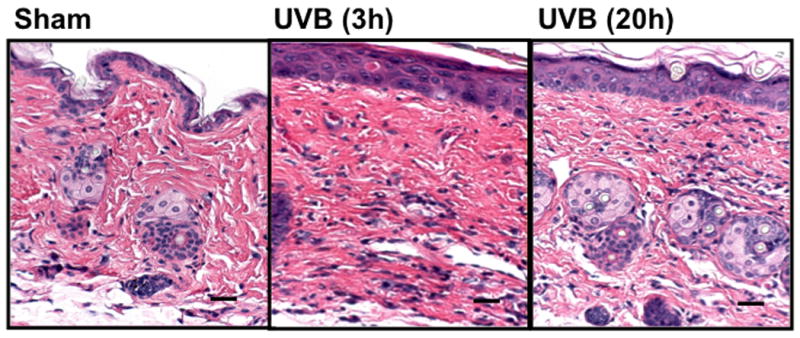
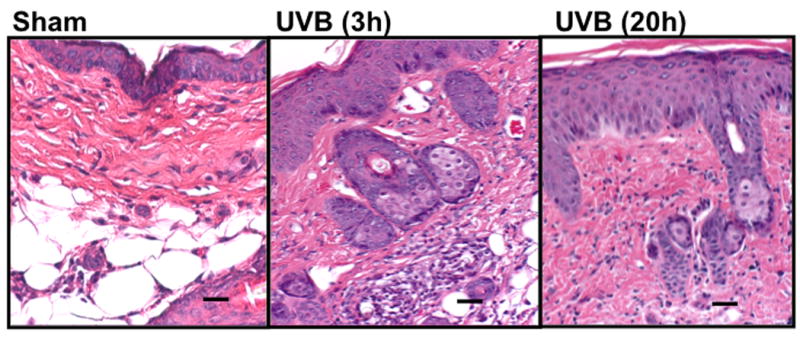
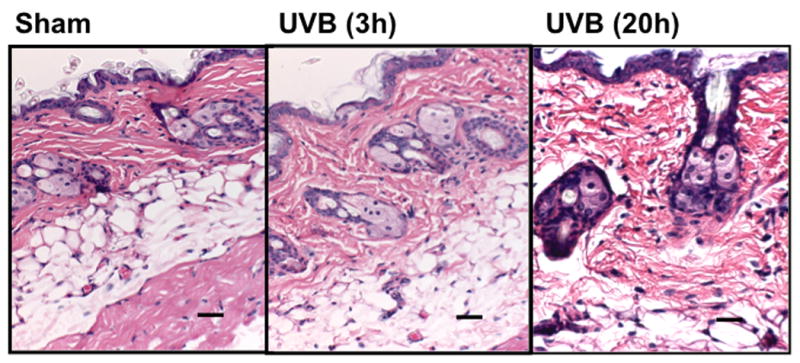
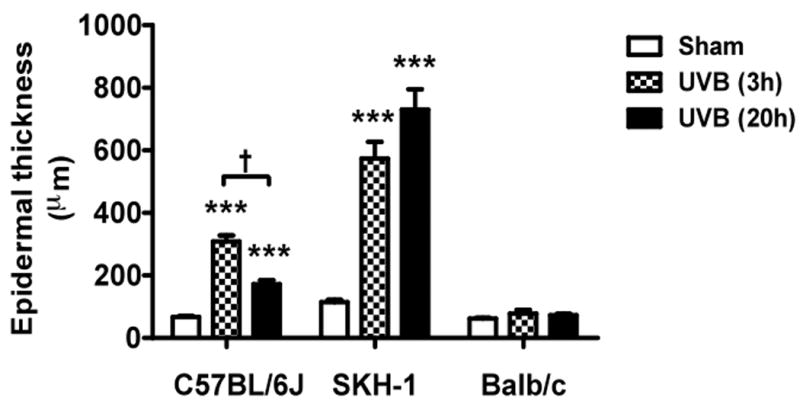
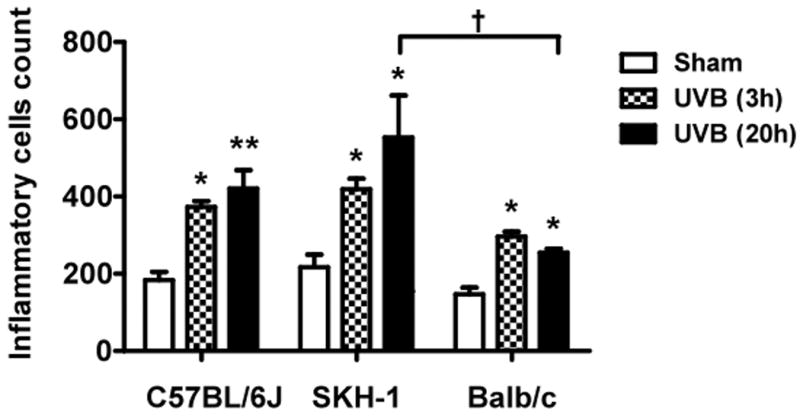
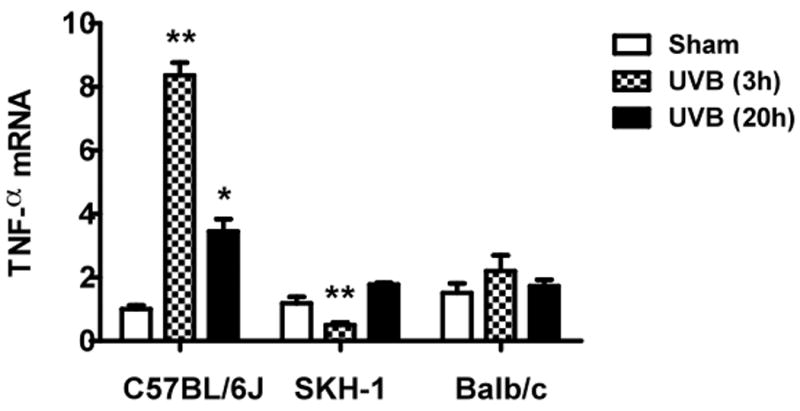
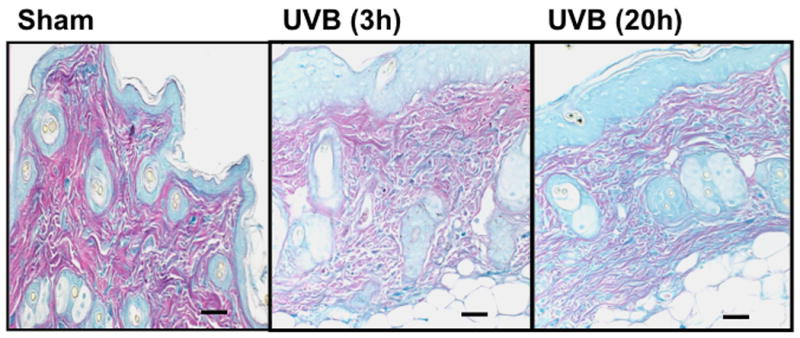
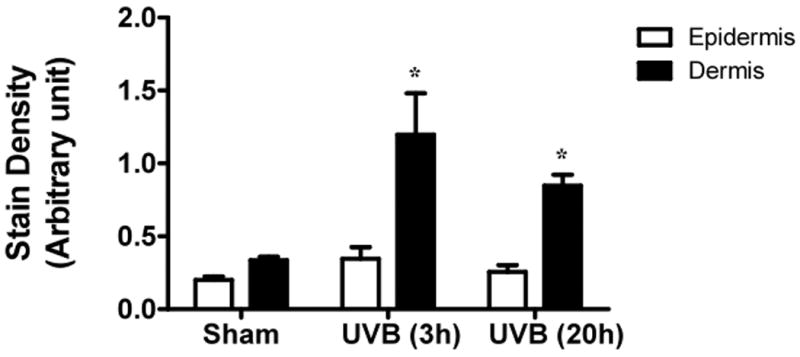
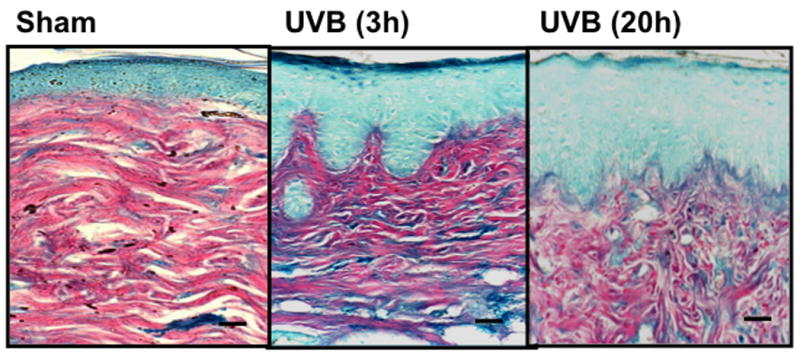
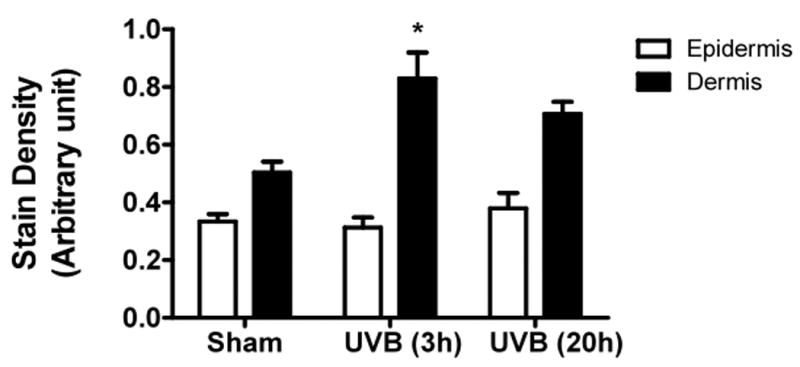
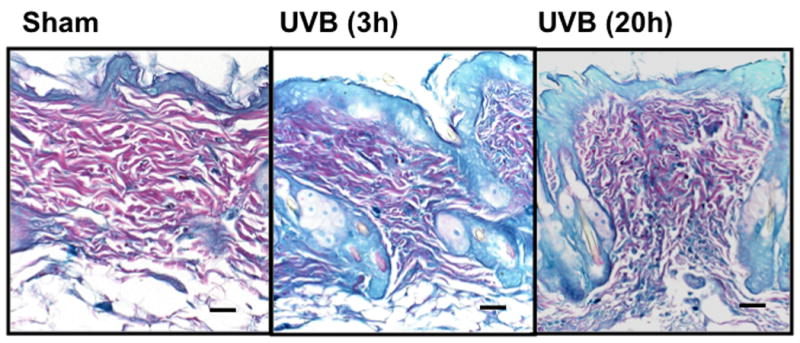
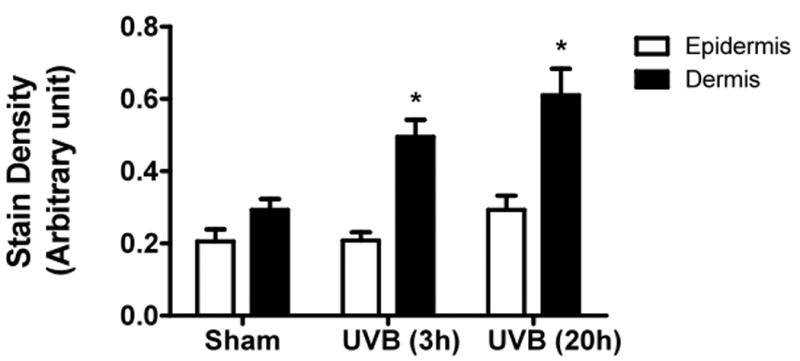
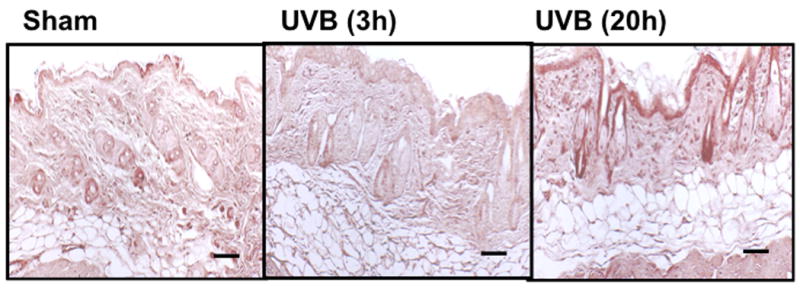
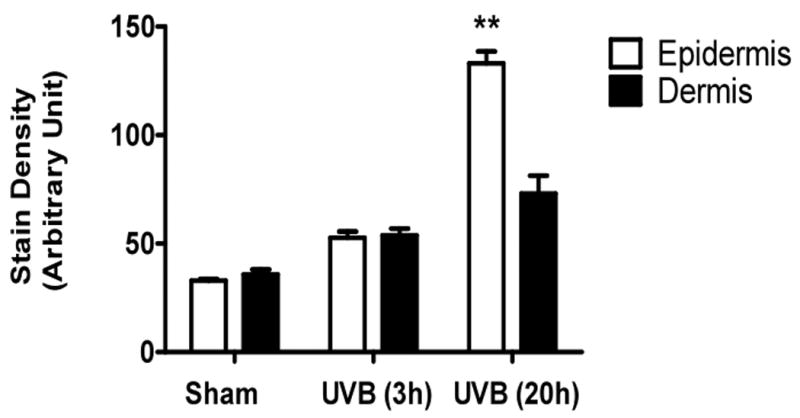
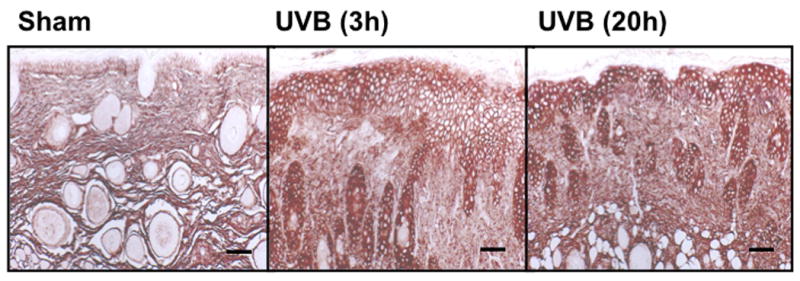
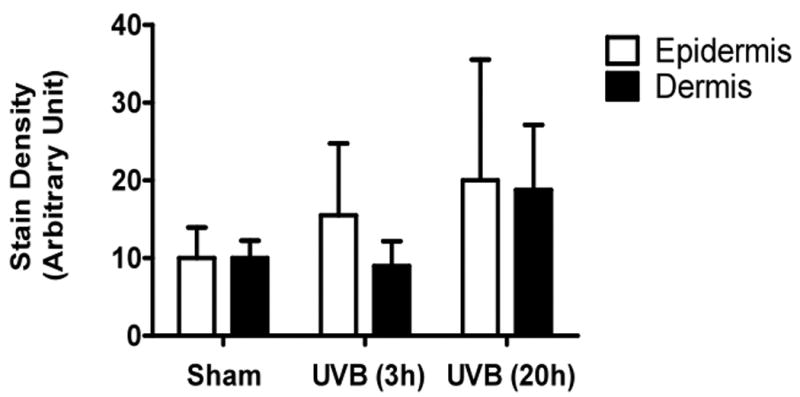
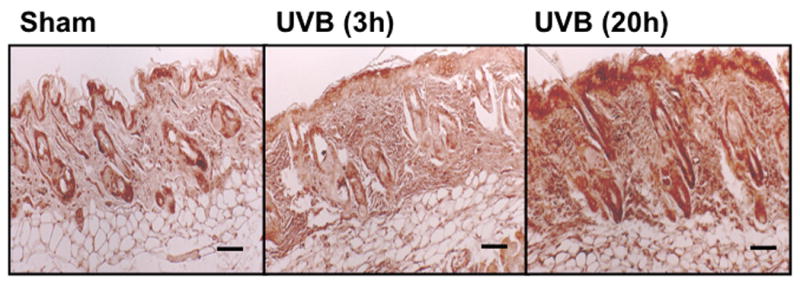
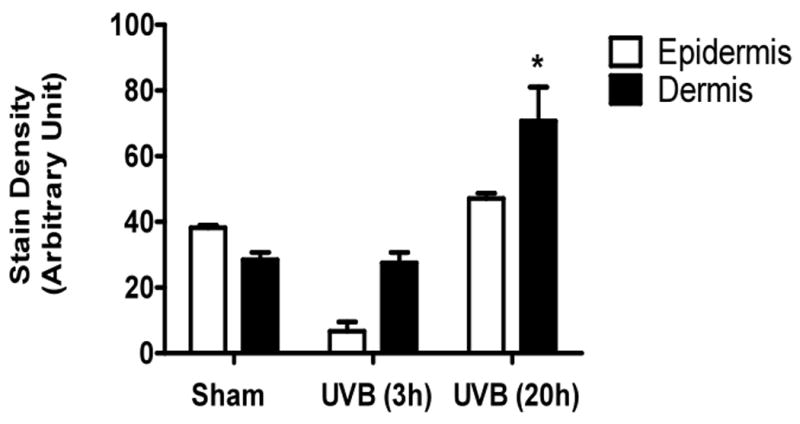
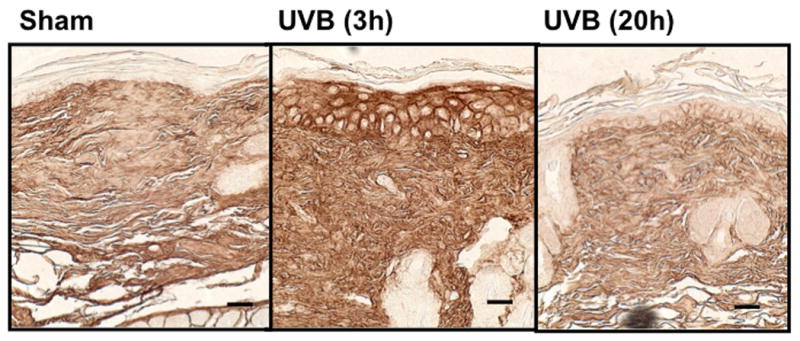
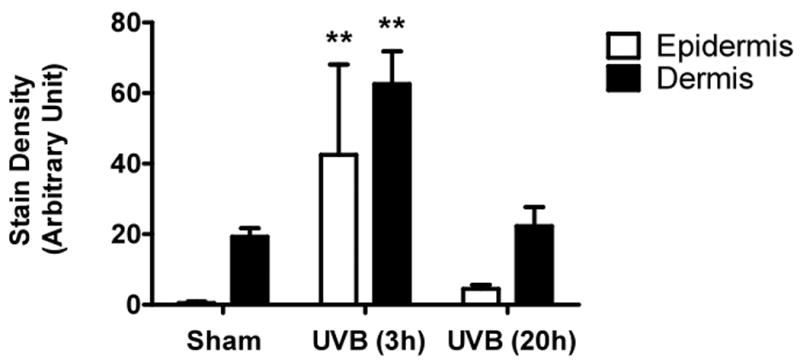
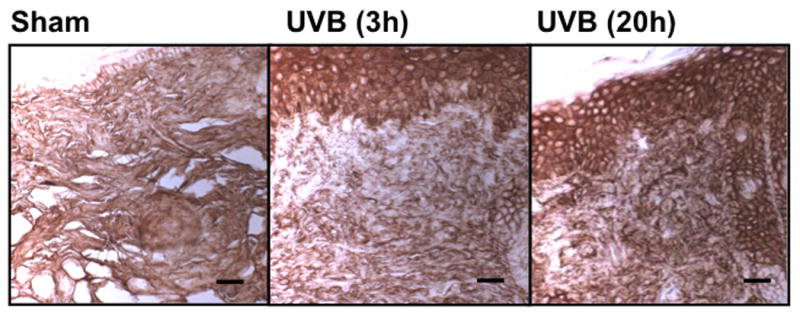
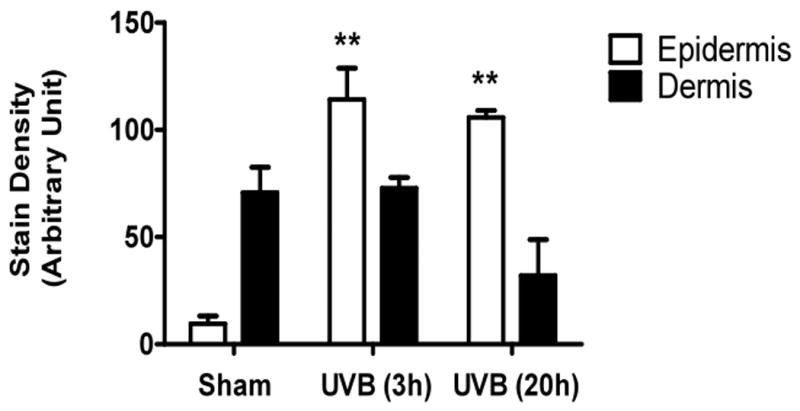
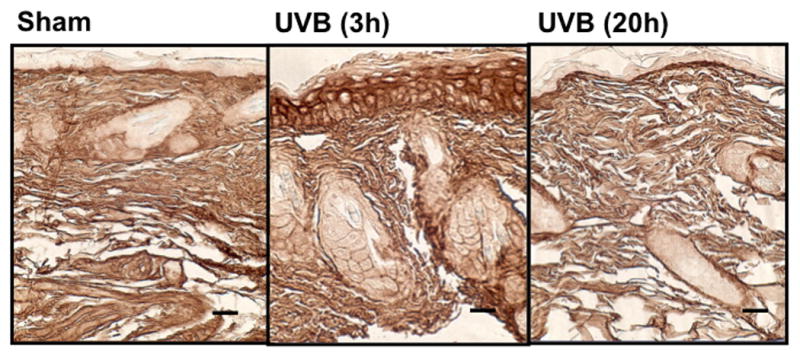
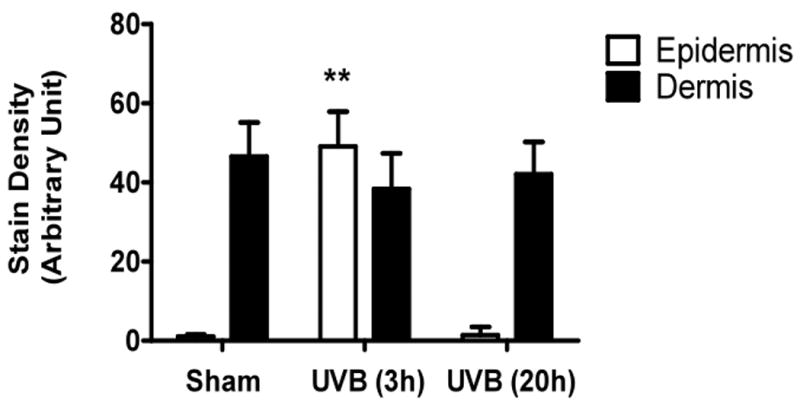
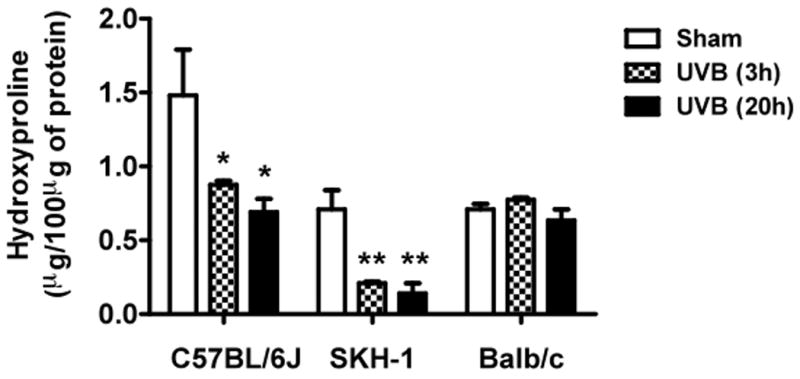
Human cutaneous photodamage is a major medical problem that includes premature aging and fragility of the skin. Nonxenografted animal models have not been comparatively evaluated for how well they resemble the changes seen in human skin. Here, we sought to identify a suitable mouse model that recapitulates key anatomic, cellular and molecular responses observed in human skin during acute UV exposure. Adult females from three strains of mice, C57BL/6J, SKH1 and Balb/c were exposed to UVB and then evaluated 3 or 20 h after the last irradiation. Skin from UVB-exposed C57BL/6J mice showed features resembling human photodamage, including epidermal thickening, infiltration of the dermis with inflammatory cells, induction of tumor necrosis factor-α (TNF-α) mRNA, accumulation of glycosaminoglycans, particularly hyaluronan in the epidermis and loss of collagen. Hairless SKH1 mouse skin responded similarly, but without any induction of TNF-α mRNA or chondroitin sulfate. Irradiated Balb/c mice were the least similar to humans. Our results in C57BL/6J mice and to a lesser extent in SKH1 mice, show cutaneous responses to a course of UVB-irradiation that mirror those seen in human skin. Proper choice of model is critical for investigating cellular and molecular mechanisms of photodamage and photoaging.


Figures

Figure 1
Figure 1. UVB exposure increased the thickness of epidermis and inflammatory cells influx in the dermis
Epidermal thickness was measured in H & E stained skin sections (200×) using imagePro Plus software. (a) C57BL/6J; (b) SKH-1; (c) Balb/c; bar size = 50 μm; (d) Mean±SEM (four animals/condition); (e) Inflammatory cells were counted in 10 high power fields for each skin section. P values were obtained by analysis of variance, followed by Dunnett and Bonferroni's post-test. ***=p< 0.001, ** =p< 0.01, * =p< 0.05, †= p<0.05.
Figure 2
Figure 2. Expression of TNFα mRNA in UVB-irradiated mice
Mice were irradiated and sacrificed 3h and 20h after the last UVB exposure. RNA samples were collected at the indicated times and analyzed by real-time PCR. TNFα mRNA cycle numbers were normalized to GAPDH. Expression levels of TNFα mRNA are indicated as “fold change” compared to control animals (a) C57BL/6J; (b) SKH-1; (c) Balb/c mice. ** =p< 0.01, * =p< 0.05.
Figure 3
Figure 3. UVB exposure increased the total GAGs in UVB-irradiated mice
Histochemical staining of total GAGs was performed using Hale stain (200×). The blue color stains GAGs and red color stains collagen fibers. Hale staining was quantitated using ImagePro program. (a) C57BL/6J; (b) C57BL/6J Hale quantitation; (c) SKH-1; (d) SKH-1 Hale quantitation; (e) Balb/c mice; (f) Balb/c Hale quantitation; bar size = 50 μm. *= p< 0.05.
Figure 4
Figure 4. Chondroitin sulfate was increased in the dermis of Balb/c mice 20h after the last exposure to UVB, similar to humans
Immunohistochemical staining of CS was performed using biotinylated antibody and visualized using streptavidin-horseradish peroxidase and DAB complex (200×). Staining of CS was quantified in epidermis and dermis using ImagePro software and presented in graphical form. (a) C57BL/6J; (b) C57BL/6J CS quantitation (c) SKH-1; (d) SKH-1 CS quantitation; (e) Balb/c mice; (f) Balb/c CS quantitation. bar size = 50 μm. **= p< 0.01, *= p< 0.05.
Figure 5
Figure 5. UVB increased the expression of hyaluronic acid in the epidermis of all strains of mice, but only in the dermis of C57BL/6J mice 3h after the last exposure to UVB
Immunohistochemical staining of HA was performed using biotinylated hyaluronan binding protein and visualized using streptavidin-horseradish peroxidase and DAB complex (200×). Staining of HA was quantified in the epidermis and dermis using ImagePro software. (a) C57BL/6J; (b) C57BL/6J HA quantitation; (c) SKH-1; (d) SKH-1 HA quantitation; (e) Balb/c mice; (f) Balb/c HA quantitation. bar size = 50 μm. ** =p< 0.01.
Figure 6
Figure 6. Collagen content decreased in C57BL/6J and SKH-1 mice, while no change was observed in Balb/c mice
Collagen content was measured using hydroxyproline level in the skin homogenates. ** =p< 0.01, *= p< 0.05.

Similar articles

Cited by

References

    1. Averbeck M, Gebhardt CA, Voigt S, Beilharz S, Anderegg U, Termeer CC, Sleeman JP, Simon JC. Differential regulation of hyaluronan metabolism in the epidermal and dermal compartments of human skin by UVB irradiation. The Journal of investigative dermatology. 2007;127:687–97. - PubMed
    1. Barr RM, Walker SL, Tsang W, Harrison GI, Ettehadi P, Greaves MW, Young AR. Suppressed alloantigen presentation, increased TNF-alpha, IL-1, IL-1Ra, IL-10, and modulation of TNF-R in UV-irradiated human skin. The Journal of investigative dermatology. 1999;112:692–8. - PubMed
    1. Bechetoille N, Dezutter-Dambuyant C, Damour O, Andre V, Orly I, Perrier E. Effects of solar ultraviolet radiation on engineered human skin equivalent containing both Langerhans cells and dermal dendritic cells. Tissue engineering. 2007;13:2667–79. - PubMed
    1. Benavides F, Oberyszyn TM, VanBuskirk AM, Reeve VE, Kusewitt DF. The hairless mouse in skin research. Journal of dermatological science. 2009;53:10–8. - PMC - PubMed
    1. Bernstein EF, Underhill CB, Hahn PJ, Brown DB, Uitto J. Chronic sun exposure alters both the content and distribution of dermal glycosaminoglycans. The British journal of dermatology. 1996;135:255–62. - PubMed

Publication types

MeSH terms