

Relationships among environmental exposures, cord blood cytokine responses, allergy, and wheeze at 1 year of age in an inner-city birth cohort (Urban Environment and Childhood Asthma study)
- PMID: 21333343
- PMCID: PMC3070829
- DOI: 10.1016/j.jaci.2010.12.1122
Relationships among environmental exposures, cord blood cytokine responses, allergy, and wheeze at 1 year of age in an inner-city birth cohort (Urban Environment and Childhood Asthma study)
Abstract
Background: The Urban Environment and Childhood Asthma study was established to investigate the immunologic and environmental causes of asthma in inner-city children.
Objective: We sought to evaluate potential atopic outcomes in the first 12 months and their relationships to environmental exposures and immune development.
Methods: A birth cohort of 560 children with at least 1 parent with allergy or asthma was established in Baltimore, Boston, New York, and St Louis. Wheezing is assessed every 3 months, allergen-specific IgE yearly, and mononuclear cell cytokine responses at birth and yearly; environmental assessments include dust allergen and endotoxin, maternal stress, and indoor nicotine and nitrogen dioxide levels.
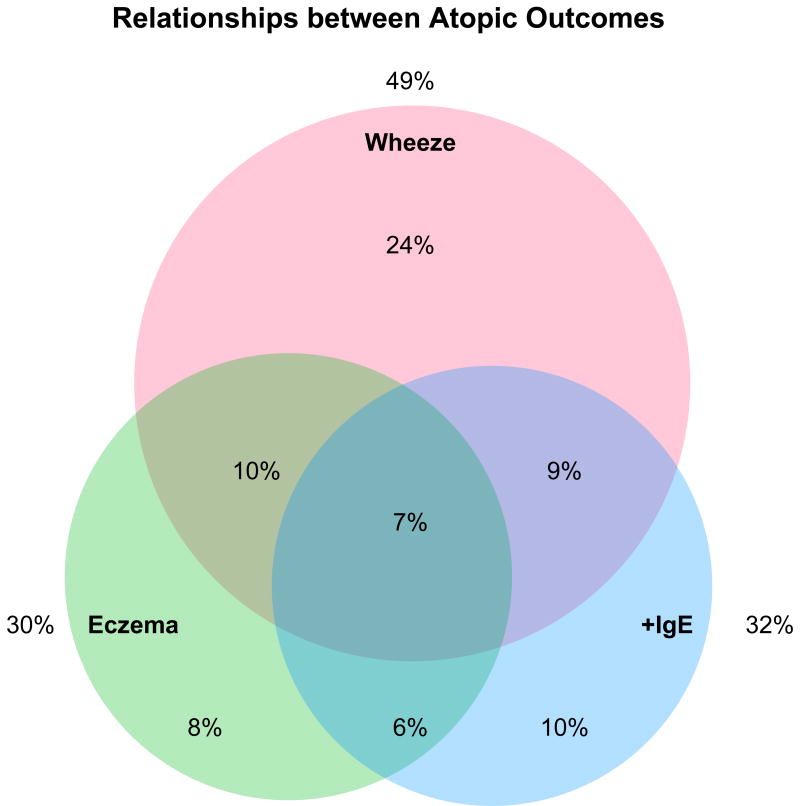
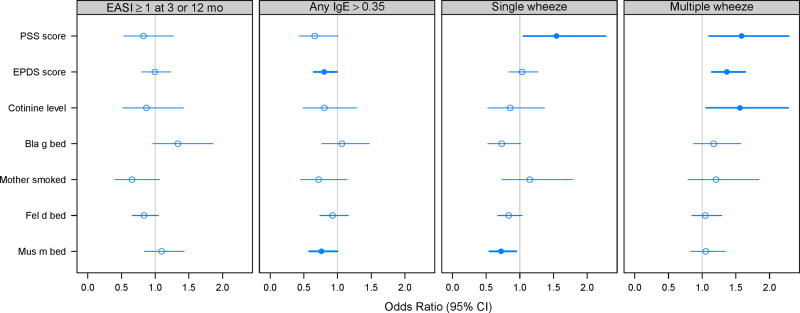
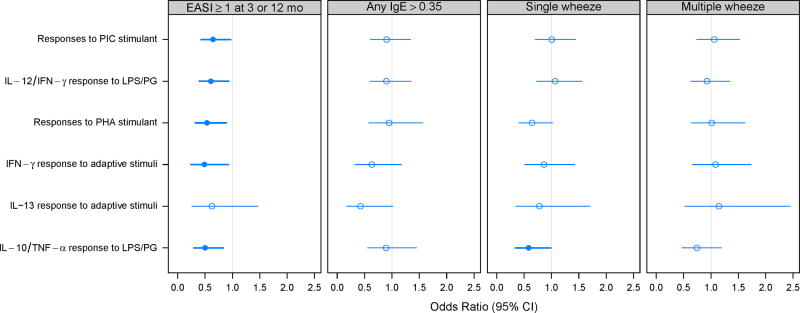
Results: Key outcomes in the first year include wheeze in 49%, 2 or more episodes of wheeze in 23%, eczema in 30%, and detectable IgE to milk, egg, and/or peanut in 32% and to cockroach in 4%. Household dust revealed levels of greater than 2 μg/g to cockroach in 40%, mite in 19%, cat in 25%, and mouse in 29%, and 66% of homes housed at least 1 smoker. Positive associations were detected between multiple wheeze and cotinine levels, maternal stress, and maternal depression, whereas cytokine responses to a variety of innate, adaptive, and mitogenic stimuli were inversely related to eczema.
Conclusions: This high-risk cohort of inner-city infants is exhibiting high rates of wheeze, eczema, and allergic sensitization. Low cytokine responses at birth might be a risk factor for eczema, whereas a variety of adverse environmental exposures contribute to the risk of wheezing in infancy. These findings provide evidence of specificity in the interactions between immune development, environmental exposures, and the development of early features that might predict future asthma.
Copyright © 2011 American Academy of Allergy, Asthma & Immunology. Published by Mosby, Inc. All rights reserved.
Figures
References
-
- Akinbami L. Asthma prevalence, health care use and mortality: United States, 2003-05. In: Services DoHaH, editor. National Center for Health Statistics. National Center for Health Statistics; 2007. - PubMed
-
- Weiss KB, Gergen PJ, Crain EF. Inner-city asthma. The epidemiology of an emerging US public health concern. Chest. 1992;101:362S–7S. - PubMed
-
- Lilly CM. Diversity of asthma: evolving concepts of pathophysiology and lessons from genetics. J Allergy Clin Immunol. 2005;115:S526–31. - PubMed
Publication types
MeSH terms
Substances
Grants and funding
- N01-AI-25482/AI/NIAID NIH HHS/United States
- N01 AI025496/AI/NIAID NIH HHS/United States
- UL1 RR024992/RR/NCRR NIH HHS/United States
- M01 RR000071/RR/NCRR NIH HHS/United States
- RR00052/RR/NCRR NIH HHS/United States
- M01RR00071/RR/NCRR NIH HHS/United States
- 1UL1RR024156/RR/NCRR NIH HHS/United States
- HHSN272200900052C/AI/NIAID NIH HHS/United States
- N01-AI-25496/AI/NIAID NIH HHS/United States
- 5UL1RR024992-02/RR/NCRR NIH HHS/United States
- M01RR00533/RR/NCRR NIH HHS/United States
- N01 AI025482/AI/NIAID NIH HHS/United States
- M01 RR000533/RR/NCRR NIH HHS/United States
- UL1 RR024156/RR/NCRR NIH HHS/United States
- UL1 RR025771/RR/NCRR NIH HHS/United States
- M01 RR000052/RR/NCRR NIH HHS/United States
- 1UL1RR025771/RR/NCRR NIH HHS/United States
LinkOut - more resources
Full Text Sources
Other Literature Sources
Medical
Miscellaneous
