. 2011 Feb 25;34(2):201-12.
doi: 10.1016/j.immuni.2011.01.017. Epub 2011 Feb 17.

The kinases MEKK2 and MEKK3 regulate transforming growth factor-β-mediated helper T cell differentiation

Affiliations

The kinases MEKK2 and MEKK3 regulate transforming growth factor-β-mediated helper T cell differentiation

Xing Chang et al. Immunity. .

Abstract

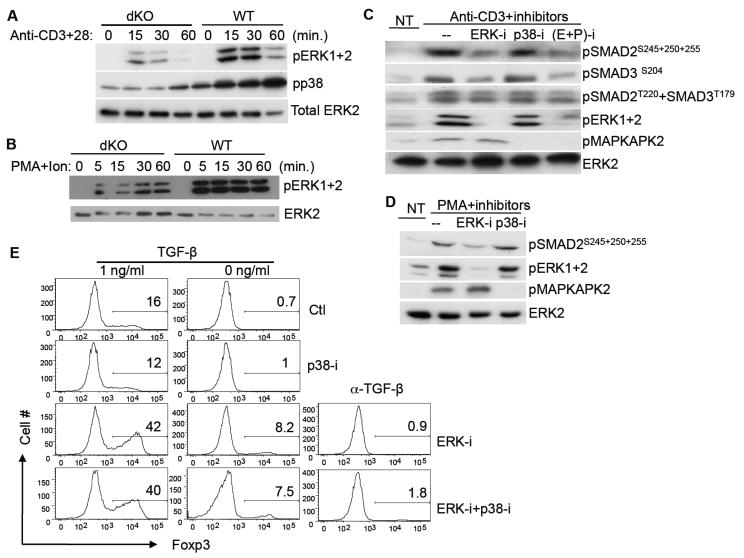
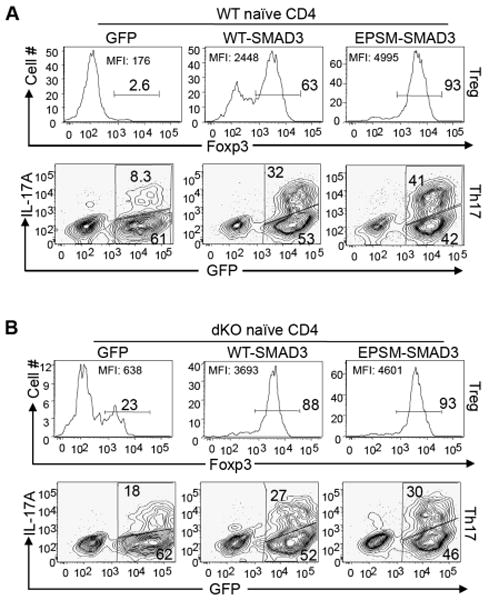
Mitogen-activated protein kinases (MAPKs) are key mediators of the T cell receptor (TCR) signals but their roles in T helper (Th) cell differentiation are unclear. Here we showed that the MAPK kinase kinases MEKK2 (encoded by Map3k2) and MEKK3 (encoded by Map3k3) negatively regulated transforming growth factor-β (TGF-β)-mediated Th cell differentiation. Map3k2(-/-)Map3k3(Lck-Cre/-) mice showed an abnormal accumulation of regulatory T (Treg) and Th17 cells in the periphery, consistent with Map3k2(-/-)Map3k3(Lck-Cre/-) naive CD4(+) T cells' differentiation into Treg and Th17 cells with a higher frequency than wild-type (WT) cells after TGF-β stimulation in vitro. In addition, Map3k2(-/-)Map3k3(Lck-Cre/-) mice developed more severe experimental autoimmune encephalomyelitis. Map3k2(-/-)Map3k3(Lck-Cre/-) T cells exhibited impaired phosphorylation of SMAD2 and SMAD3 proteins at their linker regions, which negatively regulated the TGF-β responses in T cells. Thus, the crosstalk between TCR-induced MAPK and the TGF-β signaling pathways is important in regulating Th cell differentiation.


Figures

Figure 1
Figure 1. Loss of Map3k2 and Map3k3 in T cells Results in Accumulation of Treg and Th17 Cells in vivo
(A) Splenocytes from wild type (WT) and Map3k2-/-Map3k3Lck-Cre/- (dKO) mice were stained for CD4, CD8, CD44 and CD62L and analyzed by flow cytometry. The percentages of CD4+ and CD8+ T cells are shown at the upper panels. The gated CD4+ T cells were further analyzed for CD44+ and CD62L+ sub-populations (lower panels). Numbers in the profiles indicate the percentages of the gated populations. (B) Splenocytes were stained for CD4 and Foxp3 to show the percentages (numbers in the gated boxes) of Foxp3+CD4+ T cells (Treg) in the spleen of WT and dKO mice. Data shown are from gated splenic CD4+ cells. FSC, forward scatter. (C) Summary of splenic Foxp3+CD4+ T cells in WT (n=8), dKO (n=5), Map3k3Lck-Cre/- (3-cKO) (n=6), and Map3k2-/- (2-KO) mice (n=6). Error bars show the standard deviation. **, p<0.01 by two tailed Student's t test. (D) Ex vivo splenocytes were stimulated with PMA+ionomycin for 6-h then analyzed for IL-17A and IFN-γ expressing CD4+ T cells by flow cytometry. The data shown were gated on CD4+ splenocytes and the percentages of IL-17A and IFN-γ expressing CD4+ T cells from WT and dKO mice are shown in the quadrants. (E) Summary of splenic Th17+ CD4+ T cells in WT (n=10), dKO (n=8), 3-cKO (n=6), and 2-KO mice (n=6). Error bars show the standard deviation. **, p<0.01 by two tailed Student's t test. (F, G) Rag1-/- mice were reconstituted with mixed bone marrow cells from B6.SJL (CD45.1+) and dKO (CD45.2+) mice, or from mixed B6.SJL (CD45.1+) and WT (CD45.2+) mice at roughly a 1 to 1 ratio. Total splenocytes in the recipient mice were analyzed 8-week late for CD4+Foxp3+ cellsF), or CD4+IL-17A+ cells (G) as indicated. Data shown are gated on CD4+CD45.1+ (B6.SJL) or CD4+CD45.2+ (WT or dKO) populations. Numbers next to the gated areas show the percentages of the gated population and the results are representative of 6 pairs of mice from two independent experiments.
Figure 2
Figure 2. MEKK2 and MEKK3 Suppress the TGF-β Mediated T Cell Differentiation in vitro
(A) Naïve CD4+ T cells (CD4+CD62LhiCD44loCD25-) from WT and Map3k2-/-Map3k3Lck-Cre/- (dKO) mice were differentiated into Foxp3+ Treg cells with the indicated concentrations of TGF-β. Induction of the Foxp3+ cells was analyzed five days after differentiation. When indicated, a TGFβ antibody (α-TGFβ) (5 ug/ml) was added throughout the culture. (B) Naïve dKO CD4+ T cells (CD45.2+) or WT B6.SJL CD4+ T cells (CD45.1+) were differentiated into Treg cells alone or in a mixed culture at a 1:1 ratio without exogenous TGF-β. The frequencies of differentiated Foxp3+ cells from dKO and B6.SJL CD4+ T cells were determined five days later. (C) Naïve CD4+ T cells from either WT or dKO mice were differentiated into Th17 cells with indicated concentrations of TGF-β and 20 ng/ml IL-6. At day five, the differentiated cells were washed and restimulated with PMA+ionomycin for 4 h and the IL17A+ and Foxp3+ cells were determined by flow cytometry. (D) Naïve CD4+ T cells from either WT or dKO mice were differentiated into Th1 cells with 10 ng/ml IL-12 plus indicated concentrations of TGF-β. At day five, the IFN-γ+ and IL-17A+ cells were determined by flow cytometry as in panel C. (A-D) The numbers in the graphs indicate the percentages of the gated populations. Data are representative of either three (A, C, and D) or two (B) independent experiments.
Figure 3
Figure 3. Inhibition of TGF-βSignaling in the Map3k2-/-Map3k3Lck-Cre/- Mice Reduces Treg and Th17 cells in the Periphery
(A) Map3k2-/-Map3k3Lck-Cre/- (dKO) mice were treated with TGFβRI inhibitor SB431542 or DMSO every other day for ten days. The Foxp3+ CD4+ T cells in the peripheral blood of dKO mice before the treatment (day 0) and 10 days after the treatment (Day 10) were determined. The numbers next to the gated boxes show the percentages of the gated populations. Data are representative of three independent experiments. (B) Summary of Foxp3+ cells as the percentages of total CD4+ T cells in the peripheral blood of 3-pairs of wild type (WT) and dKO mice before and after treated with SB431542 or DMSO. Each symbol in the graph represents one individual mouse. (C, D) Splenic CD4 T cells from the dKO mice that were treated with SB431542 or DMSO were analyzed for the frequency of Foxp3+ population (C) or IL17A+ population (D) by flow cytometry. The numbers next to the gated boxes show the percentages of the gated populations. Data are representative of five mice per group from two independent experiments.
Figure 4
Figure 4. MEKK2 and MEKK3 Mediate R-SMAD Linker Phosphorylation and Inhibit SMAD Transcriptional Activity
(A) CAGA12-Luc plasmid was nucleofected into WT or dKO CD4+ T cells. Four hours after nucleofection, cells were stimulated with anti-CD3+anti-CD28 antibodies with or without TGF-β as indicated. Luciferase activity was determined 16 h later and normalized to the activity of non-TGF-β stimulated cells. (B) An illustration of known phosphorylation sites in SMAD2 and SMAD3. MH1 and MH2: MAD homology domain 1 and 2; linker: the sequence that links MH1 and MH2 domains. (C) WT or dKO CD4+ T cells were stimulated with 10 ng/ml TGF-β as indicated and the SMAD3 phosphorylation at the C-terminus (Ser423/425) was determined by immunoblotting. The ERK2 level is used as a loading control. (D) WT or dKO CD4+ T cells were stimulated with anti-CD3+anti-CD28 antibodies (Anti-CD3+28) for the indicated time periods. Phosphorylation of the SMAD2 and SMAD3 linker regions at SMAD2 Ser245+250+255, SMAD3 Ser204, SMAD2 Thr220, and SMAD3 Thr179 was determined by immunoblotting. Total SMAD2 and SMAD3 protein levels were determined by immunoblotting. Actin level is shown as a loading control. (E) WT and dKO CD4 T cells were stimulated with PMA+ionomycin (PMA+Ion) for the indicated time periods. Phosphorylation of the SMAD2 linker region and total SMAD2 protein was determined by immunoblotting. (F) SMAD3 expression vector was co-transfected with either empty expression vector (Ctl), or expression vectors for Map3k2 (KK2) or Map3k3 (KK3) into 293T cells. Twenty-four h after transfection, phosphorylation of SMAD3 at the linker region was determined. ERK1 and 2 activation and expression of SMAD3, MEKK2, and MEKK3 in the same transfection was determined by immunoblotting as indicated. (G) CAGA12-Luc reporter plasmid was co-transfected into 293T cells with either empty expression vector (Ctl), or expression vectors for Map3k2 or Map3k3. Twenty-four h after transfection, cells were stimulated with the indicated concentrations of TGF-β for additional 12 h. The reporter activity was determined with a duel luciferase kit. The reporter activity without TGF-β stimulation was arbitrarily set as value 1 and used for normalization of the relative reporter activity. (A-G) Data shown are representative of three independent experiments. Error bars in (A) and (G) show standard deviation. **, p<0.01 by two tailed Student's t test.
Figure 5
Figure 5. ERK1 and 2 Mediate the TCR-Induced SMAD Linker Region Phosphorylation and Inhibit the TGF-β Induced Treg Differentiation
(A, B) WT or dKO CD4+ T cells were stimulated with anti-CD3+anti-CD28 antibodies (Anti-CD3+28) (A) or with PMA+ionomycin (PMA+Ion) (B) for the indicated time periods. Phosphorylation of ERK1 and 2, and p38 was determined by immunoblotting. Total ERK2 protein level was shown as a loading control. (C, D) WT CD4+ T cells were activated with an anti-CD3 antibody (C) or with PMA treatment (D) in the presence of vehicle DMSO (Ctl), or MEK1/2 inhibitor U0126 (ERK-i), or p38 inhibitor SB203580 (p38-i), or both {(E+P)-i} as indicated. Phosphorylations of SMAD2 or SMAD3 at their linker regions and phosphorylation of ERK1 and 2, and p38 at their activation loop, were determined by immunoblotting. ERK2 protein level was determined as a loading control. NT, non-stimulated cells. (E) WT naïve CD4 T cells were differentiated into Treg cells with either no TGF-β or 1 ng/ml TGF-β in the presence of no inhibitor (Ctl), or MEK1 inhibitor (ERK-i), or p38 inhibitor (p38-i), or both inhibitors (ERK-i+p38-i), as indicated. Foxp3+ Treg cells were determined five days later by flow cytometry as described in Figure 2. (A-E) Data presented are representative of three independent experiments.
Figure 6
Figure 6. MEKK2 and MEKK3 Regulate Treg and Th17 Differentiation Through Mediating R-SMAD Linker Phosphorylation
WT (A) or dKO CD4+ T cells (B) were differentiated under the Treg or Th17 conditions, respectively, as described in Figure 2, except that the TGF-β (1 ng/ml) was added at the 24 h time point when the cells were infected with empty retrovirus (GFP), or retroviruses that express WT-SMAD3, or EPSM-SMAD3. The infection was repeated once at 36 h. Five days later, the infected cells were determined by GFP expression and analyzed for Foxp3+ cells directly (upper panels), or analyzed for IL-17A+ cells (lower panels) after re-stimulation with PMA+ionomycin for 4 h. The numbers in the graphs show the percentages of gated populations. Data are representative of two independent experiments.
Figure 7
Figure 7. Map3k2-/-Map3k3Lck-Cre/- Mice Exhibit More Severe EAE Disease and Accumulate More Th17 cells in the Acute Inflammatory Response
(A) WT (n=5) and dKO (n=4) mice were immunized with MOG35-55+CFA plus pertussis toxin to induce EAE disease. The immunized mice were observed for the indicated length of time and the mean clinical scores for the severity of EAE were determined. (B) Sublethally irradiated Rag1-/- mice were reconstituted with either dKO (n=4) or WT (n=5) bone marrow cells. Ten weeks after the reconstitution, EAE disease was induced and analyzed as described in panel A. (A-B) Data shown are representative of two independent experiments. Error bars show standard error of the mean. **, p<0.01, *, p<0.05, by two tailed Student's t test. (C, D). EAE disease was induced in WT or dKO mice as described in panel A. Twenty eight days after the immunization, CD4+ T cells were gated from the total leukocytes in the central nervous system (CNS) or spleen (SPL), and further analyzed for frequencies of IL-17A+ and IFN-γ+ cells (C), and Foxp3+ cells (D) by flow cytometry. The numbers in the plots indicate the percentages of the gated populations. Data shown are representative of three independent experiments. (E, F) On day 8 after MOG+CFA immunization, WT or dKO splenocytes were restimulated with indicated concentrations of MOG peptide in vitro. The production of IL-17A (E) and IFN-γ (F) in culture supernatants was determined three days later by ELISA. Data shown are average values of triplicates. Error bars show standard deviation. The results are representative of four mice of each genotype from two independent experiments. **, p<0.01 by two tailed Student's t test.

References

    1. Agrawal A, Dillon S, Denning TL, Pulendran B. ERK1-/- mice exhibit Th1 cell polarization and increased susceptibility to experimental autoimmune encephalomyelitis. J Immunol. 2006;176:5788–5796. - PubMed
    1. Alarcon C, Zaromytidou AI, Xi Q, Gao S, Yu J, Fujisawa S, Barlas A, Miller AN, Manova-Todorova K, Macias MJ, et al. Nuclear CDKs drive Smad transcriptional activation and turnover in BMP and TGF-beta pathways. Cell. 2009;139:757–769. - PMC - PubMed
    1. Bettelli E, Carrier Y, Gao W, Korn T, Strom TB, Oukka M, Weiner HL, Kuchroo VK. Reciprocal developmental pathways for the generation of pathogenic effector TH17 and regulatory T cells. Nature. 2006;441:235–238. - PubMed
    1. Bettelli E, Oukka M, Kuchroo VK. T(H)-17 cells in the circle of immunity and autoimmunity. Nat Immunol. 2007;8:345–350. - PubMed
    1. Calonge MJ, Massague J. Smad4/DPC4 silencing and hyperactive Ras jointly disrupt transforming growth factor-beta antiproliferative responses in colon cancer cells. J Biol Chem. 1999;274:33637–33643. - PubMed

Publication types

MeSH terms

Associated data

LinkOut - more resources