Comparative Study
. 2011 May 5:181:48-66.
doi: 10.1016/j.neuroscience.2011.02.029. Epub 2011 Feb 17.

A non-canonical start codon in the Drosophila fragile X gene yields two functional isoforms

Affiliations
Comparative Study

A non-canonical start codon in the Drosophila fragile X gene yields two functional isoforms

R W Beerman et al. Neuroscience. .

Abstract

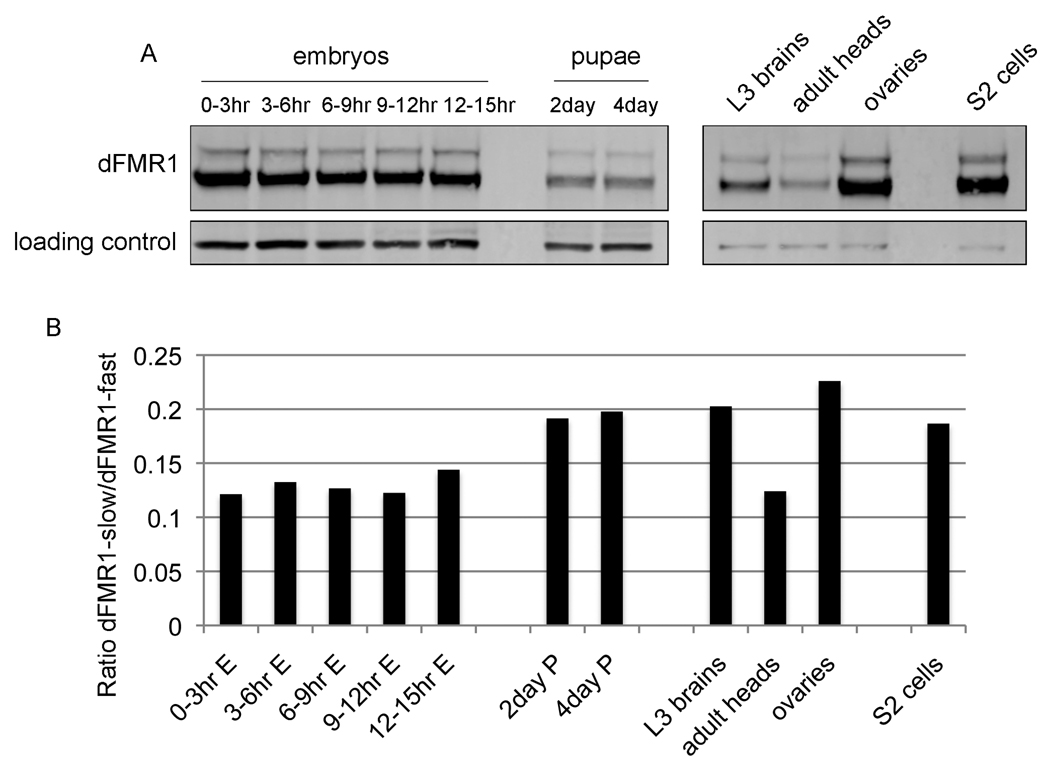
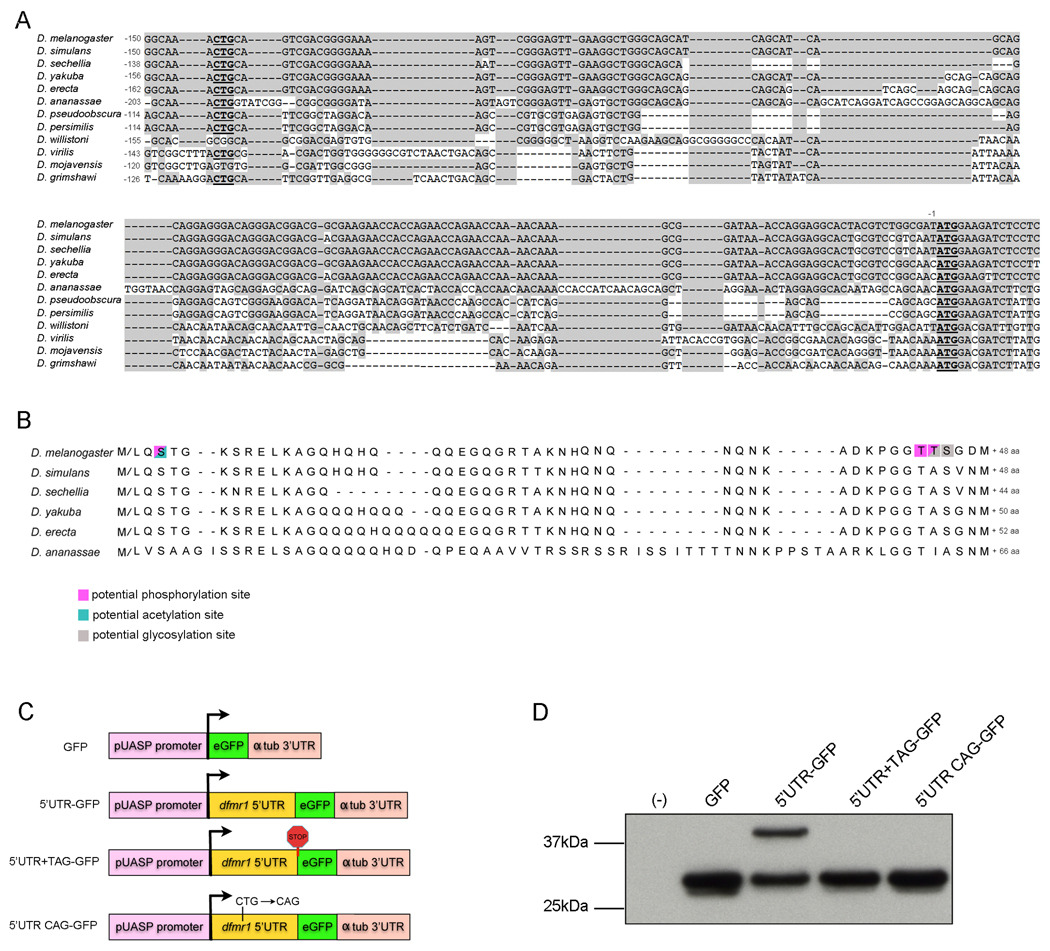
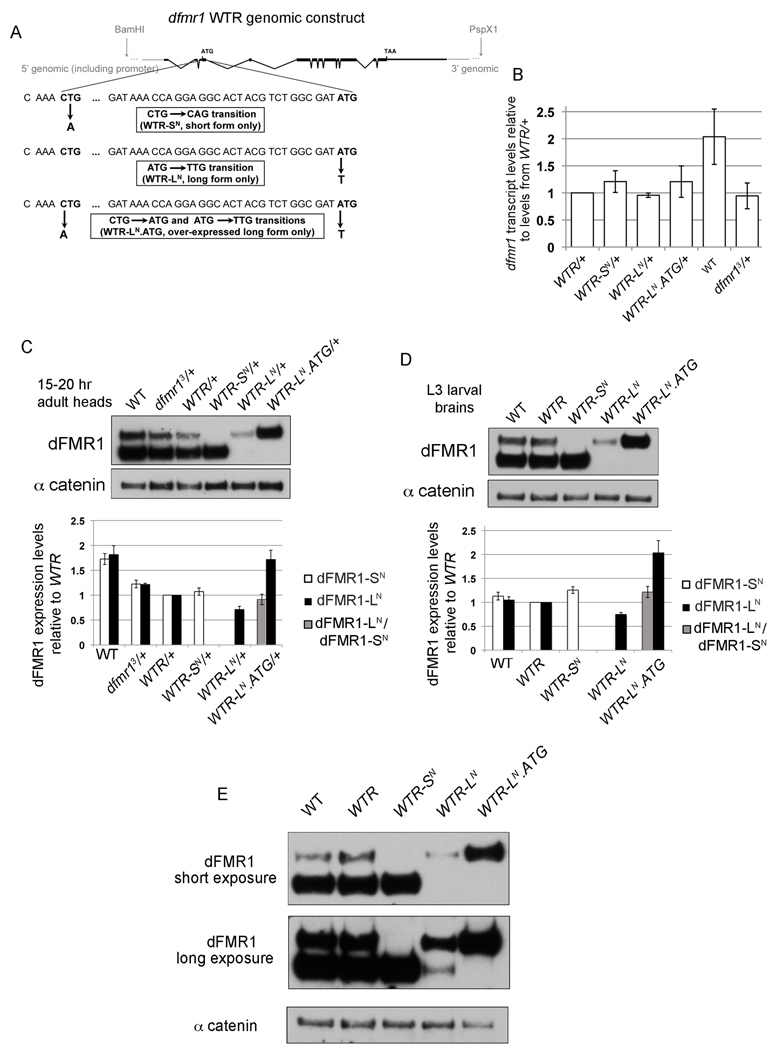
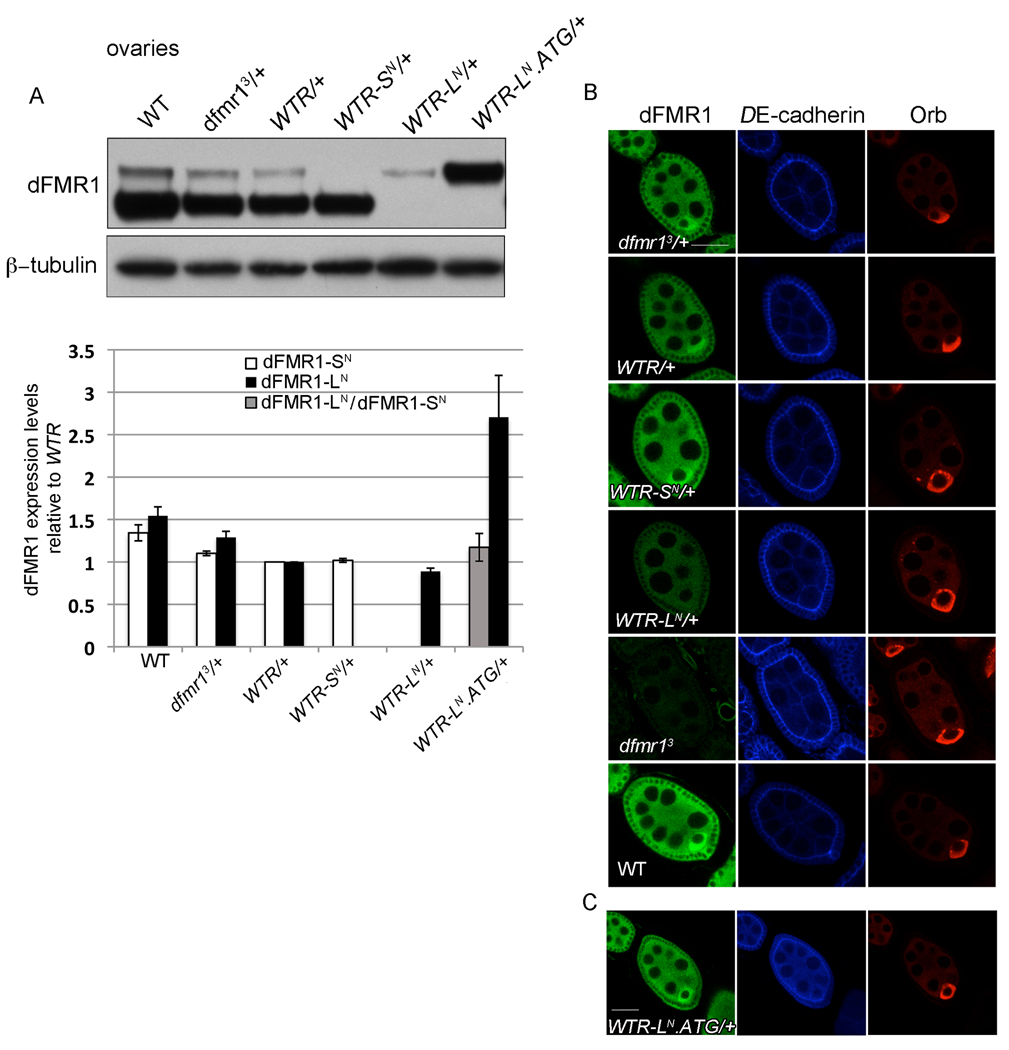
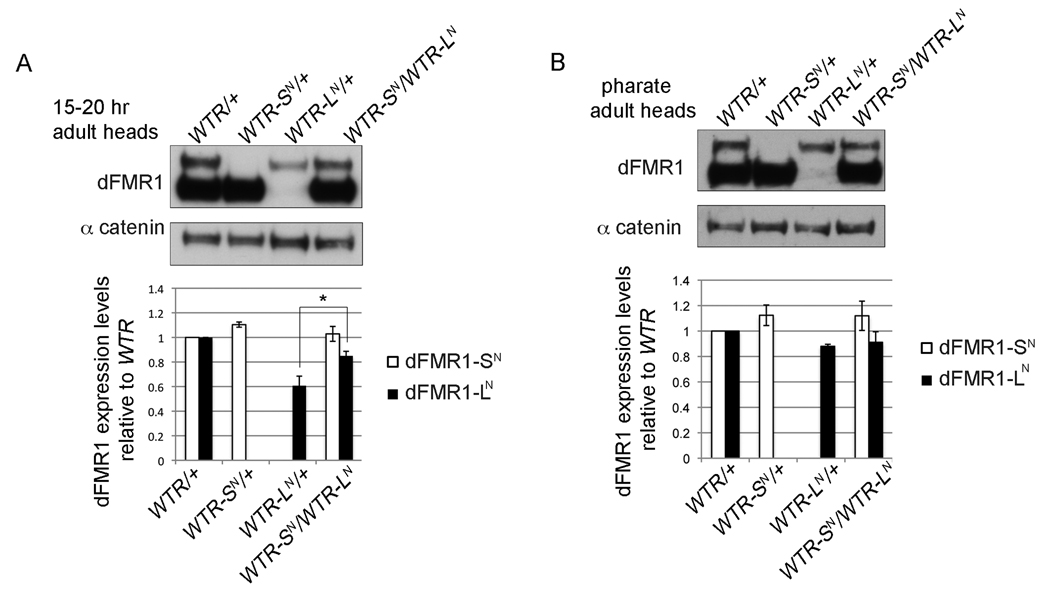
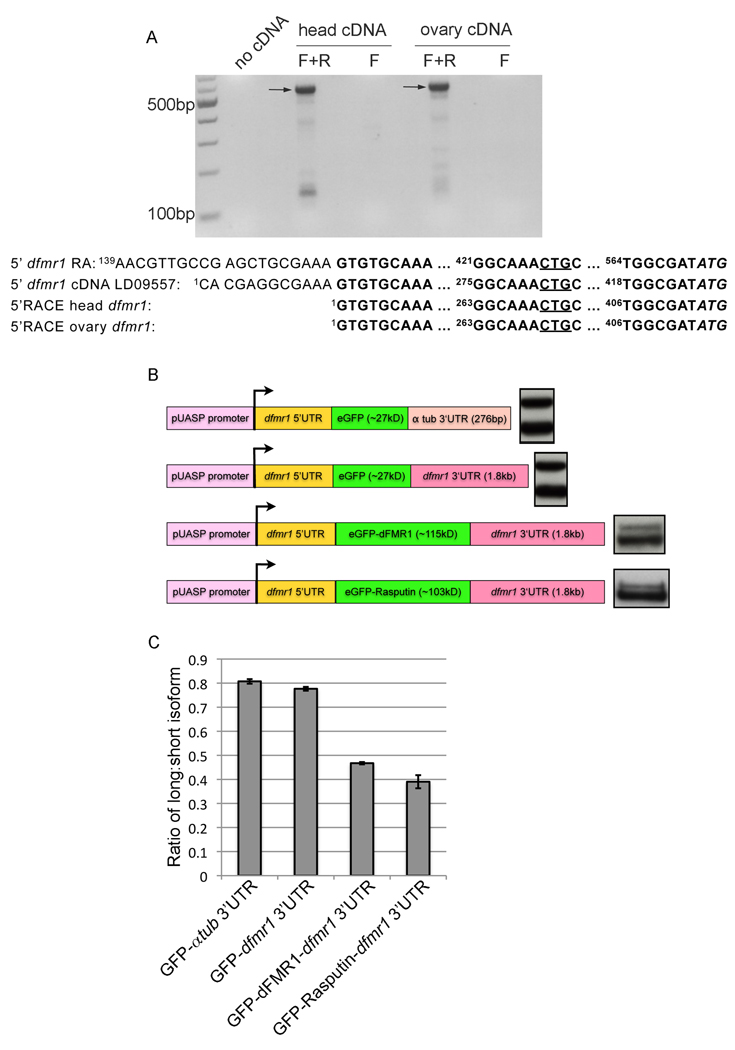
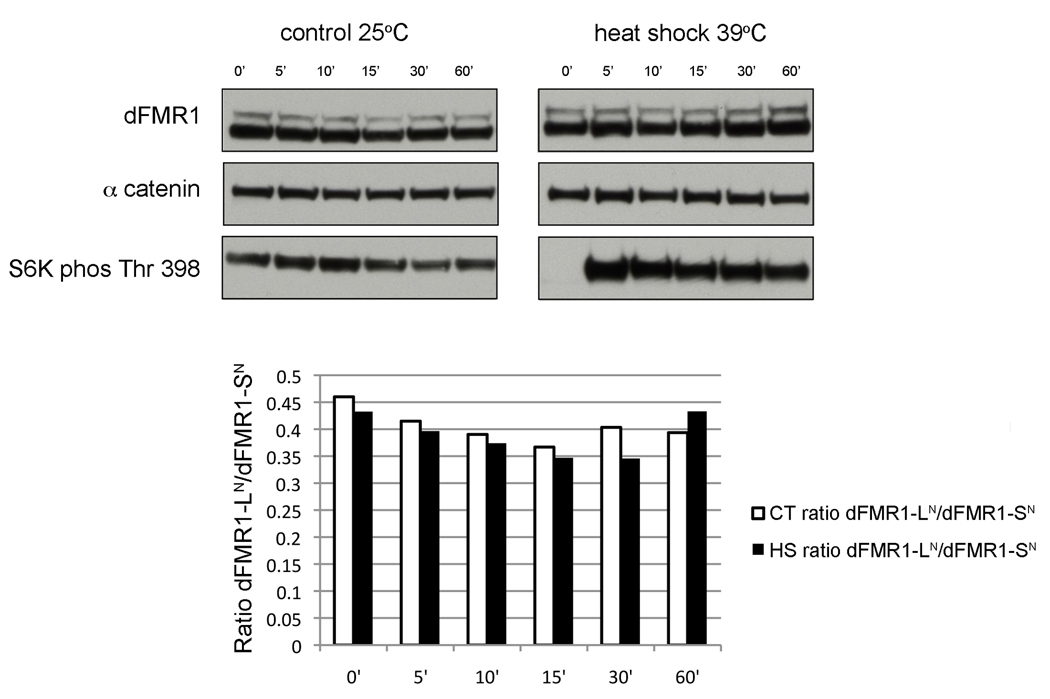
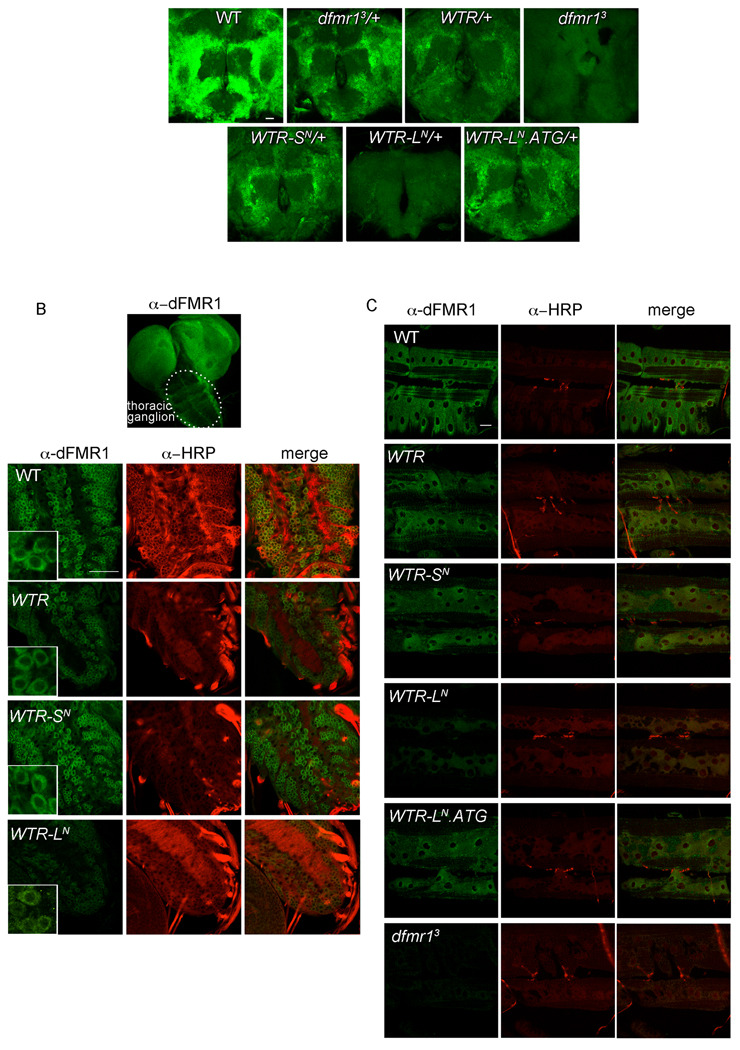
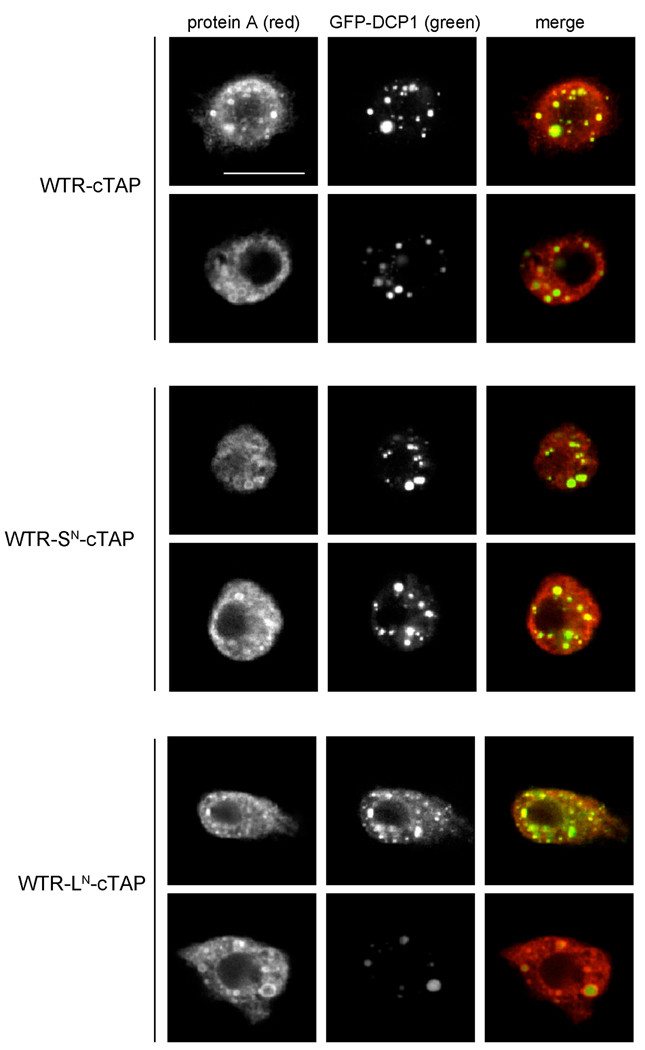
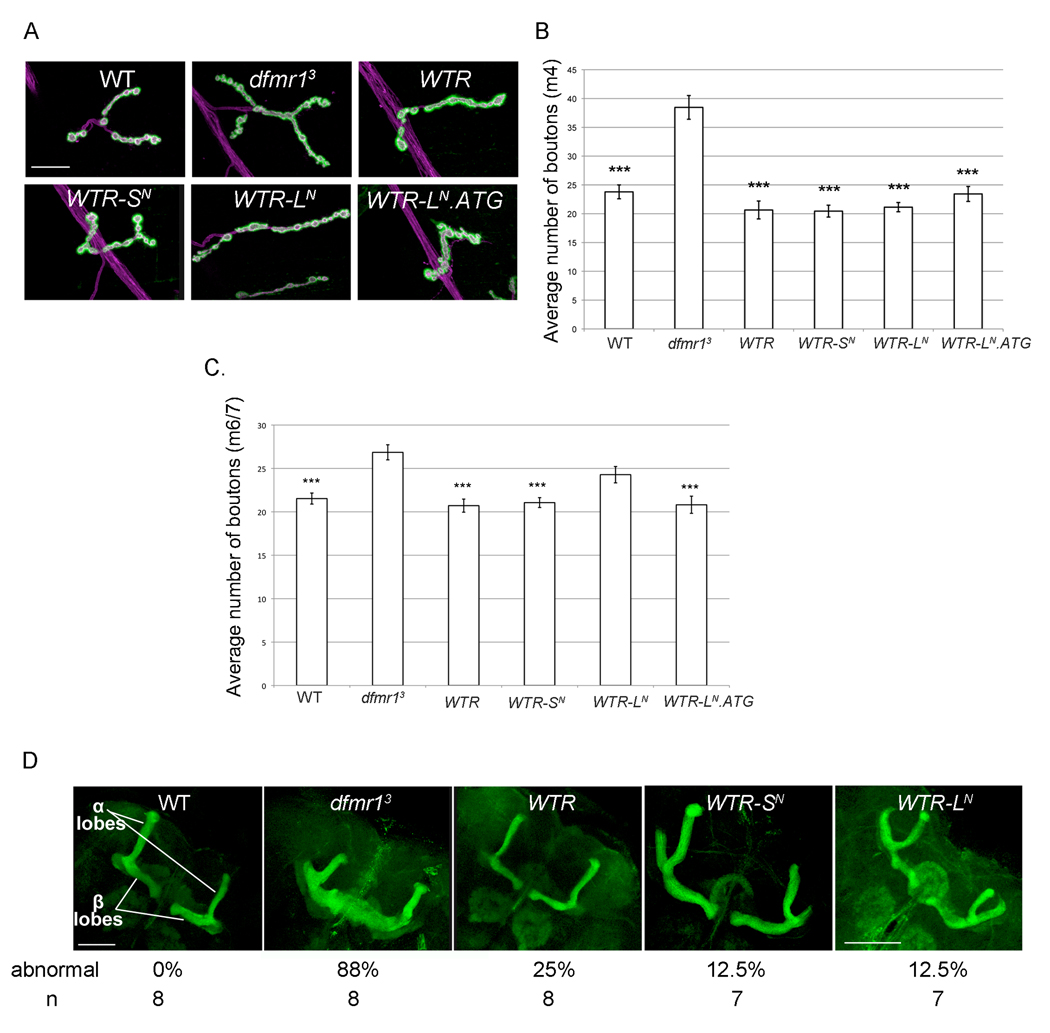
Fragile X syndrome is caused by the loss of expression of the fragile X mental retardation protein (FMRP). As a RNA binding protein, FMRP functions in translational regulation, localization, and stability of its neuronal target transcripts. The Drosophila homologue, dFMR1, is well conserved in sequence and function with respect to human FMRP. Although dFMR1 is known to express two main isoforms, the mechanism behind production of the second, more slowly migrating isoform has remained elusive. Furthermore, it remains unknown whether the two isoforms may also contribute differentially to dFMR1 function. We have found that this second dFMR1 isoform is generated through an alternative translational start site in the dfmr1 5'UTR. This 5'UTR coding sequence is well conserved in the melanogaster group. Translation of the predominant, smaller form of dFMR1 (dFMR1-S(N)) begins at a canonical start codon (ATG), whereas translation of the minor, larger form (dFMR1-L(N)) begins upstream at a non-canonical start codon (CTG). To assess the contribution of the N-terminal extension toward dFMR1 activity, we generated transgenic flies that exclusively express either dFMR1-S(N) or dFMR1-L(N). Expression analyses throughout development revealed that dFMR1-S(N) is required for normal dFMR1-L(N) expression levels in adult brains. In situ expression analyses showed that either dFMR1-S(N) or dFMR1-L(N) is individually sufficient for proper dFMR1 localization in the nervous system. Functional studies demonstrated that both dFMR1-S(N) and dFMR1-L(N) can function independently to rescue dfmr1 null defects in synaptogenesis and axon guidance. Thus, dfmr1 encodes two functional isoforms with respect to expression and activity throughout neuronal development.


Figures

Figure 1
Figure 1
dfmr1 is expressed as two protein isoforms throughout development. (A) Western analyses of protein lysates collected from various developmental time points from wild-type flies: whole embryos 0–3hr, 3–6hr, 6–9hr, 9–12hr, 12–15hr, whole pupae at 2 days and 4 days, 3rd instar larval brains, 1 day-old adult heads, ovaries from adult females, and S2 cells. Western blots were probed with α-dFMR1 and β-tubulin as loading controls. (B) Graph depicts skewed ratio between dFMR1 isoforms from the western blot shown in A, and is representative of other experiments carried out, but not included in this quantification (i.e., slower migrating isoform is expressed at ~0.1–0.2 fold lower than faster migrating form).
Figure 2
Figure 2
dfmr1 5'UTR contains an alternative translational start site. (A) Alignment of dfmr1 5‘UTR sequences. The conserved CTG and the normal ATG start codon are in bold and underscored. Shaded sequence is conserved with the D. melanogaster dfmr1 5'UTR. The nucleotide positions are numbered individually for each sequence relative to the ATG start codon. (B) Alignment of theoretical dFMR1 N-terminal peptide translated from CTG (methionine or leucine) to ATG (methionine) in 6/12 Drosophila species. The number next to each sequence indicates the number of additional amino acids within the putative N-terminal peptide for each species. Residues predicted to be competent for phosphorylation, acetylation, and/or glycosylation are highlighted in pink, blue, or grey respectively. (C) Schematic of GFP reporter constructs used for transient transfection, comprised of pUASP promoter, GFP coding region, and a-tubulin 3'UTR in all constructs, and dfmr1 5'UTR in some constructs. (D) Representative western blot for GFP using protein lysates extracted from S2 cells transiently transfected with the following constructs: (−) no transfection; (GFP) GFP-α-tubulin 3‘UTR; (5‘UTR-GFP) dfmr1 5‘UTR-GFP-α-tubulin 3‘UTR; (5‘UTR+TAG-GFP) dfmr1 5‘UTR-GFP-α-tubulin 3‘UTR with TAG stop codon inserted just upstream of GFP start codon; and (5'UTR CAG-GFP) dfmr1 5‘UTR-GFP-α-tubulin 3‘UTR with point mutation that changes CTG→CAG.
Figure 3
Figure 3
Transgenic fly strains express dFMR1 isoforms at endogenous levels. (A) Schematic Figure of the dfmr1 genomic rescue construct denoting the restriction sites used to subclone the construct into an attB vector and the sequence around the point mutations introduced to generate constructs that will only produce one isoform of dFMR1. Black boxes and lines represent the dfmr1 exons and introns respectively and gray lines denote 5' and 3' genomic sequence also contained in the construct. The alternative CTG and canonical ATG start codons are in bold and ellipses denote nucleotides that are absent due to space constraints. Each point mutant construct is illustrated: WTR-SN contains a CTG→CAG transition, WTR-LN contains an ATG→TTG transition, and WTR-LN.ATG contains two transitions: CTG→ATG and ATG→TTG. (B) dfmr1 transcript levels were graphed as an average ratio to dfmr1 levels from WTR/+ flies after normalization to 28S transcript levels using QT-PCR from total head RNA of 15–20hr flies. Error bars are s.e.m. calculated from three biological replicates (with one outlier removed for WT). (C,D) Representative western blots for dFMR1 protein in 15–20 hr adult heads (C) and 3rd instar larval brains (D). Graphed below each representative blot is the quantification of average dFMR1-SN (white bar) or dFMR1-LN (black bar) levels (normalized to α-catenin as a loading control) relative to dFMR1-SN or dFMR1-LN from WTR/+ heads. Quantification of dFMR1-LN relative to dFMR1-SN from WTR/+ is graphed as a gray column. Error bars are s.e.m. calculated from at least three biological replicates. (E) Representative shorter (top panel) and longer (middle panel) exposures of a western blot for dFMR1 protein from 3rd instar larval brains. α-catenin protein levels are shown as a loading control.
Figure 4
Figure 4
dFMR1-SN and dFMR1-LN are expressed and localized similarly during oogenesis. (A) Representative western blot of dFMR1 protein from ovaries of 3–5 day old females. Graphed below is the quantification of average dFMR1-SN (white bar) or dFMR1-LN (black bar) levels (normalized to loading control) relative to dFMR1-SN or dFMR1-LN from WTR/+ ovaries. Quantification of dFMR1-LN relative to dFMR1-SN from WTR/+ is graphed as a gray column. Error bars are s.e.m. calculated from at least three biological replicates. (B,C) Representative images of whole mount immunostaining with α-dFMR1 (green), α-DE-cadherin (blue) and α-Orb (red) in egg chambers, with all images taken together with the same settings (B) and images taken with similar settings on a different day (C). Scale bars are 25µm.
Figure 5
Figure 5
dFMR1-SN is required for normal dFMR1-LN expression levels in heads of newly eclosed adults. Representative western blots of dFMR1 protein in 15–20 hr adult heads (A) and pharate adult heads (B). Graphed below each representative blot is the quantification of average dFMR1-SN (white bar) or dFMR1-LN (black bar) levels (normalized to α-catenin as a loading control) relative to dFMR1-SN or dFMR1-LN from WTR/+ heads. Error bars are s.e.m. calculated from at least three biological replicates, *p = 0.0286 (Mann-Whitney test).
Figure 6
Figure 6
Uneven expression ratio between dFMR1-LN and dFMR1-SN is maintained through post-transcriptional regulation. (A) 5' RACE cDNA from head and ovary RNA extracts were amplified by RT-PCR using nested primers and the products were visualized using an ethidium bromide stained agarose gel. One main dfmr1 5' start transcription site was identified (indicated by arrows). Additional control lanes in which the PCR reaction was carried out with no cDNA or only with the forward nested primer "F" are also shown. Below the RT-PCR is a summary of the sequencing results from the bands labeled with the arrows and the 5' sequence from two other previously described dfmr1 transcripts (dfmr1 RA, and embryo EST clone LD09557) are included above the 5'RACE sequence results for reference. Numbers in superscript refer to the nucleotide position after the transcription start, which is denoted as "1." (B) A schematic of GFP reporter constructs used for transient transfection in S2 cells is placed adjacent to each representative western blot for GFP protein. Approximate masses of GFP (in kilodaltons) if ATG start codon from GFP is used and approximate lengths of various 3'UTR sequences (in base pairs) are denoted within the schematic. (C) Quantification of (B) as ratio between long-GFP/short-GFP isoforms graphed as the mean ratio from three biological replicates and error bars are s.e.m.
Figure 7
Figure 7
Ratio of dFMR1-LN to dFMR1-SN levels remains constant after heat shock. Representative western blot for dFMR1 protein in 1–2 day old adult heads from WT flies at various time points (0 min, 5min, 10min, 15min, 30 min, or 60 min) after a 1hr treatment at 25°C (control) or 39°C (heat shock). Levels of β-tubulin are used as a loading control and levels of S6 kinase (phosphorylated at Thr 398) were used to show that the heat-shock treatment did indeed elicit a heat shock response (S6 Kinase is dephosphorylated at time 0 min after heat shock, but not in the control) (Olsen et al., 1983). The graph illustrates the ratio of dFMR1-LN signal to dFMR1-SN signal at each time point from control flies (white bars) and heat-shocked flies (black bars) and is representative of another experiment carried out, but not included in this quantification.
Figure 8
Figure 8
dFMR1-LN and dFMR1-SN are similarly localized in the central and peripheral nervous system. (A) Representative images of whole mount immunostaining with α-dFMR1 (green) in 2–5 day male brains. Scale bar is 25µm. (B) Image box set apart shows dFMR1 staining throughout a WT 3rd instar larval brain, with the thoracic ganglion encircled. Below are representative images of whole mount immunostaining with α-dFMR1 (green) and α-HRP (red) specifically from the thoracic ganglion. Scale bar is 25µm. Inset boxes magnify a few cells from the whole image to illustrate the cytoplasmic localization of dFMR1 (note that dFMR1-LN levels in inset box for WTR-LN were increased from original image using levels adjustments to emphasize dFMR1-LN localization). (C) Representative images of whole mount immunostaining with α-dFMR1 (green, enriched in post-synaptic muscle) and α-HRP (red, highlighting pre-synaptic innervation) in 3rd instar larval NMJ at A3, muscle 6/7. Scale bar is 25µm.
Figure 9
Figure 9
Both dFMR1-LN and dFMR1-SN associate with P body component DCP1 in S2 cells. Representative confocal images from S2 cells transiently co-transfected with carboxyl-terminal TAP tagged dfmr1 WTR constructs (visualized with anti-protein A, red) and GFP-DCP1 (visualized without antibodies, green). The WTR-cTAP construct produces both dFMR1-LN and dFMR1-SN, whereas WTR-SN-cTAP only produces dFMR1-SN, and WTR-LN-cTAP only produces dFMR1-LN. The constructs are described in more detail in the experimental procedures section. Scale bar is 10µm.
Figure 10
Figure 10
dFMR1-LN is not required for dFMR1 function in specifying proper morphology within the peripheral and central nervous systems. (A) Representative images of whole mount immunostaining with α-DLG (green) and α-HRP (magenta) in 3rd instar larvae at NMJ A3, muscle 4. Scale bar is 25µm. (B,C) Quantification of average bouton number (type 1b from A3 muscle 4 in (B) and type1b from A3 muscle 6/7 (C), error bars are s.e.m. ***p<0.001 (Kruskal-Wallis test (nonparametric ANOVA) analysis followed by Dunn's multiple comparisons test, indicated a statistically significant probability that there is a difference between genotypes with asterisks and dfmr13. (D) Representative images of whole mount immunostaining with α-fasciclin II (green) in pharate adult brains. Percentage of abnormal brains (with β-lobe fusion) and number of brains (n) analyzed for the percentage calculation are listed below each representative image. Scale bar is 50 µm for all images except for WTR-LN (100µm).

References

    1. Ashley CT, Jr, Wilkinson KD, Reines D, Warren ST. FMR1 protein: conserved RNP family domains and selective RNA binding. Science. 1993a;262:563–566. - PubMed
    1. Ashley CT, Sutcliffe JS, Kunst CB, Leiner HA, Eichler EE, Nelson DL, Warren ST. Human and murine FMR-1: alternative splicing and translational initiation downstream of the CGG-repeat. Nat Genet. 1993b;4:244–251. - PubMed
    1. Banerjee P, Schoenfeld BP, Bell AJ, Choi CH, Bradley MP, Hinchey P, Kollaros M, Park JH, McBride SM, Dockendorff TC. Short- and long-term memory are modulated by multiple isoforms of the fragile X mental retardation protein. J Neurosci. 2010;30:6782–6792. - PMC - PubMed
    1. Barbee SA, Estes PS, Cziko AM, Hillebrand J, Luedeman RA, Coller JM, Johnson N, Howlett IC, Geng C, Ueda R, Brand AH, Newbury SF, Wilhelm JE, Levine RB, Nakamura A, Parker R, Ramaswami M. Staufen- and FMRP-containing neuronal RNPs are structurally and functionally related to somatic P bodies. Neuron. 2006;52:997–1009. - PMC - PubMed
    1. Bischof J, Maeda RK, Hediger M, Karch F, Basler K. An optimized transgenesis system for Drosophila using germ-line-specific phiC31 integrases. Proc Natl Acad Sci U S A. 2007;104:3312–3317. - PMC - PubMed

Publication types

MeSH terms

LinkOut - more resources