. 2011 Apr 10;412(2):411-25.
doi: 10.1016/j.virol.2011.01.024. Epub 2011 Feb 21.

Cowpox virus inhibits human dendritic cell immune function by nonlethal, nonproductive infection

Affiliations

Cowpox virus inhibits human dendritic cell immune function by nonlethal, nonproductive infection

Spencer J Hansen et al. Virology. .

Abstract

Orthopoxviruses encode multiple proteins that modulate host immune responses. We determined whether cowpox virus (CPXV), a representative orthopoxvirus, modulated innate and acquired immune functions of human primary myeloid DCs and plasmacytoid DCs and monocyte-derived DCs (MDDCs). A CPXV infection of DCs at a multiplicity of infection of 10 was nonproductive, altered cellular morphology, and failed to reduce cell viability. A CPXV infection of DCs did not stimulate cytokine or chemokine secretion directly, but suppressed toll-like receptor (TLR) agonist-induced cytokine secretion and a DC-stimulated mixed leukocyte reaction (MLR). LPS-stimulated NF-κB nuclear translocation and host cytokine gene transcription were suppressed in CPXV-infected MDDCs. Early viral immunomodulatory genes were upregulated in MDDCs, consistent with early DC immunosuppression via synthesis of intracellular viral proteins. We conclude that a nonproductive CPXV infection suppressed DC immune function by synthesizing early intracellular viral proteins that suppressed DC signaling pathways.


Figures

FIGURE 1
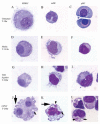
FIGURE 1. Human DCs exposed to CPXV exhibit altered morphology
MDDCs, mDCs and pDCs were either unexposed (T=0, top row), medium-exposed for 24h (T=24h, second row), TLR agonist-exposed for 24h (T=24h, third row, to LPS for MDDCs and mDCs and to influenza A for pDCs) or CPXV-exposed for 24h (T=24h, fourth row). A. MDDCs from in vitro culture demonstrated typical dendrites and single nuclei. B. Freshly isolated peripheral blood mDCs exhibited few distinguishing features aside from their monocytoid appearances. C. Freshly isolated peripheral blood pDCs demonstrated a plasmacytoid appearance. D. MDDCs after 24 h culture in medium demonstrated dendrites relatively unchanged from prior to overnight culture. E. mDCs after 24 h culture in medium developed more dendrites F. pDCs after 24 h culture appeared unchanged. G. MDDCs treated for 24 hr with LPS showed similar dendrite formation, but larger vacuoles as compared to those that were incubated overnight in medium. H. mDCs cultured overnight in LPS showed increased dendrite and vacuole formation as compared to those incubated in LPS-free medium. I. pDCs cultured with influenza A showed increased formation of surface projections with some dendrites as compared to pDCs culture overnight in virus-free medium. J. MDDCs cultured 24 h with CPXV showed blebbing and loss of dendrites with increased numbers of vacuoles. A subpopulation showed multi-nucleation; shown here is as a bi-nucleated MDDCs. K. mDCs exposed 24 h to CPXV also demonstrated excessive vacuolation, loss of dendrites and surface blebbing, and, in 24% of the cells, cytoplasmic eosinophilic inclusions, characteristic of A-type inclusions. L. pDCs exposed to CPXV for 24 h formed fewer large vacuoles as compared to mDCs, but also formed 24% of them contained eosinophilic inclusions similar to those in mDCs. Large arrows identify membrane blebs (J and K); small arrows identify vacuoles (J and L) and arrowheads identify viral inclusions (K and L). All cells were photographed with a 63× objective.
FIGURE 2
FIGURE 2. CPXV infection does not stimulate DC chemokine/cytokine secretion and inhibits DC secretion in response to TLR agonists
Human MDDCs (A, D, G), mDCs (B, E, H), and pDCs (C, F, I) were exposed to medium only, a representative TLR agonist (for MDDCs and mDCs, LPS; for pDCs, influenza A, CPXV, CPX+TLR agonist, hiCPXV or hiCPXV+LPS for 24 h. Supernatants for all experiments were assayed for the secretion of IL-1β, IL-10, IFNα, IL-6, IL-12p40, MIP-1α and TNFα, but only IL-12p40 (A, B, C), MIP-1α (D, E, F), TNFα (G, H for MDDCs) and IFNα (I for pDCs) are shown. Data are an average of 7 independent experiments for medium, LPS, CPXV, and CPXV+TLR-agonist treated DCs and 3 independent experiments for hiCPXV and hiCPXV+TLR agonist-treated DCs. Statistical analysis one-way ANOVA *=p<0.05, **=p<0.01. Statistical comparisons were between TLR agonist-treated DCs and CPXV+TLR agonist-treated DCs.
FIGURE 3
FIGURE 3. Supernatants from CPXV-infected MDDCs (A) and pDCs (B) interfere with the detection of IFNα
MDDCs (n=4) and pDCs (n=4) were infected with CPXV at MOI 10. Supernatants were collected, virus removed as described and then incubated in triplicate with a standard containing a mixture of the following cytokines: IL-10, IFNα, IL-6, IL-12p70, MIP-1α, and TNFα The “percent detected MDDCs/pDCs” was derived as pg/ml cytokine/chemokine in infected DC supernatants divided by pg/ml cytokine of standard in uninfected DC supernatants x 100. Data is the average of 4 experiments +/− SEM except for MIP-1α for MDDCs where n = 3.
FIGURE 4
FIGURE 4. DC pre-treated with live CPXV do not stimulate allogeneic CD4+ T cell proliferation
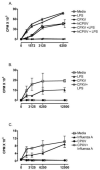
MDDCs (A), mDCs (B) and pDCs (C) were pretreated with medium only, CPXV or CPXV+TLR agonist for 24 h, washed and then incubated for five days with allogeneic CD4+ T cells. Cells were pulsed with 1 μCi of [3H] thymidine for the last 19 h of culture. Graphs are representative of four independent experiments. Statistics were computed using a two-way ANOVA. Statistical comparisons were between medium-treated DCs and CPXV-exposed DCs and between TLR agonist-treated DCs and CPXV+TLR agonist-treated DCs.
FIGURE 5
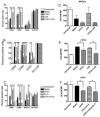
FIGURE 5. CPXV inhibits the expression of maturation markers on DCs
Four-color flow cytometric analysis of HLA-DR and the co-stimulatory molecules CD80, CD86 and CD40 was performed on untreated MDDCs (A) and mDCs (B) and after overnight incubation with medium, LPS, CPXV and CPXV+LPS. Expression of HLA-DR, BDCA2 and the costimulatory molecules CD80 and CD86 was performed on untreated pDCs and then following overnight incubation with medium, influenza A, CPXV and CPXV+influenza A (C). MFI of HLA-DR was analyzed on MDDCs (D), mDCs (E) and pDCs (F) under the same conditions as above. Data shown are an average of thee independent experiments for untreated DCs and four independent experiments for all other experimental conditions. Statistical analysis one-way ANOVA *=p<0.05, **=p<0.01 and ***=p<0.001. Statistical comparisons were between medium-treated DCs and CPXV-exposed DCs and between TLR agonist-treated DCs and CPXV+TLR agonist-treated DCs.
FIGURE 6
FIGURE 6. CPXV infection of MDDCs inhibits LPS-induced cytokine and chemokine mRNA synthesis
MDDCs were exposed to medium, LPS or CPXV+LPS and total RNA was extracted at times shown. The CT values for TNFα, MIP-1α, IL-12p40 and cyclophilin A or β-actin (endogenous control) transcripts were quantified by real-time RT-PCR. The data is shown as the fold-change (2ΔΔCT) for each transcript normalized to cyclophilin A levels and to 0 h of each treatment and is representative of four independent experiments. The kinetics of TNFα (A), MIP-1α (B) and IL-12p40 (C) transcripts in MDDCs exposed to medium (square), LPS (triangle) or CPXV+LPS (circle with dashed line) are plotted. * p-value<0.05; ** p-value<0.01; *** p-value<0.001, comparing LPS+CPXV-exposed and LPS-treated groups.
FIGURE 7
FIGURE 7. Intracellular viral immune evasion/virulence gene product detected in MDDCS as early as 2 h following CPXV infection
Total cellular extracts were prepared from uninfected DCs or DCs infected with CPXV (moi 10). Proteins were resolved by SDS-polyacrylamide gel electrophoresis (PAGE) on a 12% SDS-PAGE gel and transferred to nitrocellulose filters for immunoblot analysis using anti-CrmA polyclonal antibody (upper panel). The membrane was stripped and β-actin was detected with anti-β-actin (lower panel, AbCam mouse monoclonal clone 8226 IgG1).

Similar articles

Cited by

References

    1. Al-Alwan MM, Rowden G, Lee TD, West KA. The dendritic cell cytoskeleton is critical for the formation of the immunological synapse. J Immunol. 2001;166(3):1452–6. - PubMed
    1. Alzhanova D, Edwards DM, Hammarlund E, Scholz IG, Horst D, Wagner MJ, Upton C, Wiertz EJ, Slifka MK, Fruh K. Cowpox virus inhibits the transporter associated with antigen processing to evade T cell recognition. Cell Host Microbe. 2009;6(5):433–45. - PMC - PubMed
    1. Ardeshna KM, Pizzey AR, Devereux S, Khwaja A. The PI3 kinase, p38 SAP kinase, and NF-kappaB signal transduction pathways are involved in the survival and maturation of lipopolysaccharide-stimulated human monocyte-derived dendritic cells. Blood. 2000;96(3):1039–46. - PubMed
    1. Assarsson E, Greenbaum JA, Sundstrom M, Schaffer L, Hammond JA, Pasquetto V, Oseroff C, Hendrickson RC, Lefkowitz EJ, Tscharke DC, Sidney J, Grey HM, Head SR, Peters B, Sette A. Kinetic analysis of a complete poxvirus transcriptome reveals an immediate-early class of genes. Proc Natl Acad Sci U S A. 2008;105(6):2140–5. - PMC - PubMed
    1. Bauer M, Redecke V, Ellwart JW, Scherer B, Kremer JP, Wagner H, Lipford GB. Bacterial CpG-DNA triggers activation and maturation of human CD11c-, CD123+ dendritic cells. J Immunol. 2001;166(8):5000–7. - PubMed

Publication types