Comparative Study
. 2011 May 31;176(3):136-43.
doi: 10.1016/j.resp.2011.02.007. Epub 2011 Feb 18.

Inhibition of ventilatory motor output increases expiratory retro palatal compliance during sleep

Affiliations
Comparative Study

Inhibition of ventilatory motor output increases expiratory retro palatal compliance during sleep

Abdul Ghani Sankri-Tarbichi et al. Respir Physiol Neurobiol. .

Abstract

We hypothesized that inhibition of ventilatory motor output leads to increased pharyngeal compliance during NREM sleep, independent of lung volume.

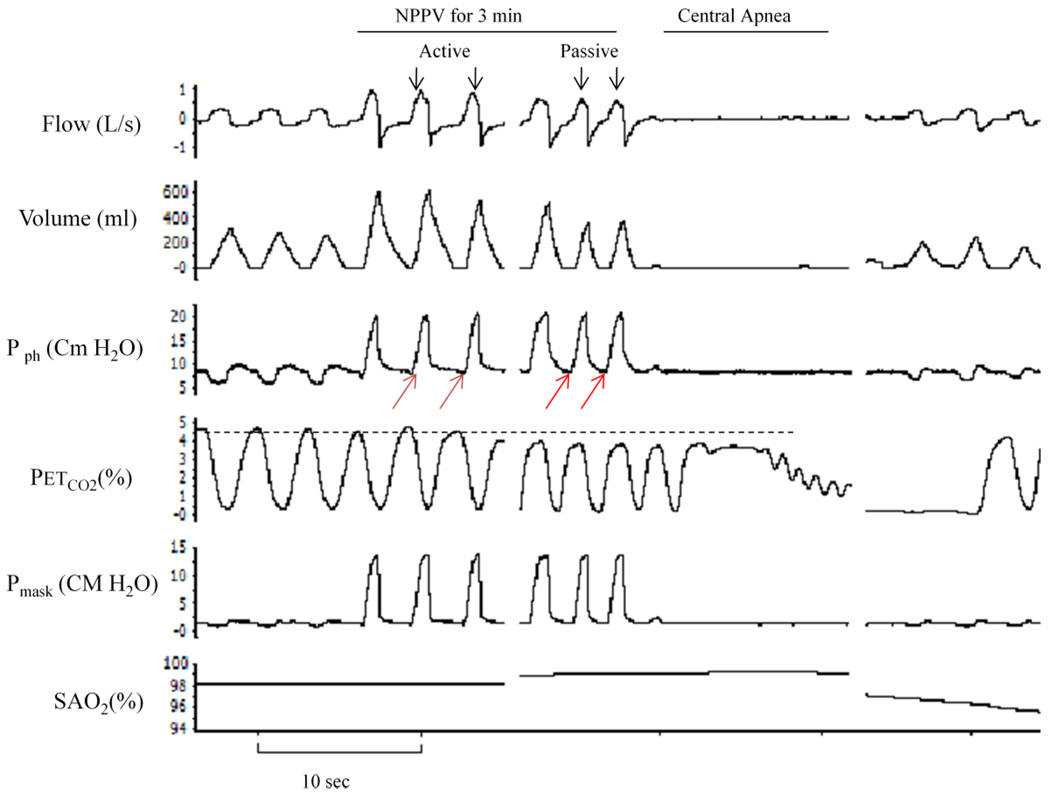
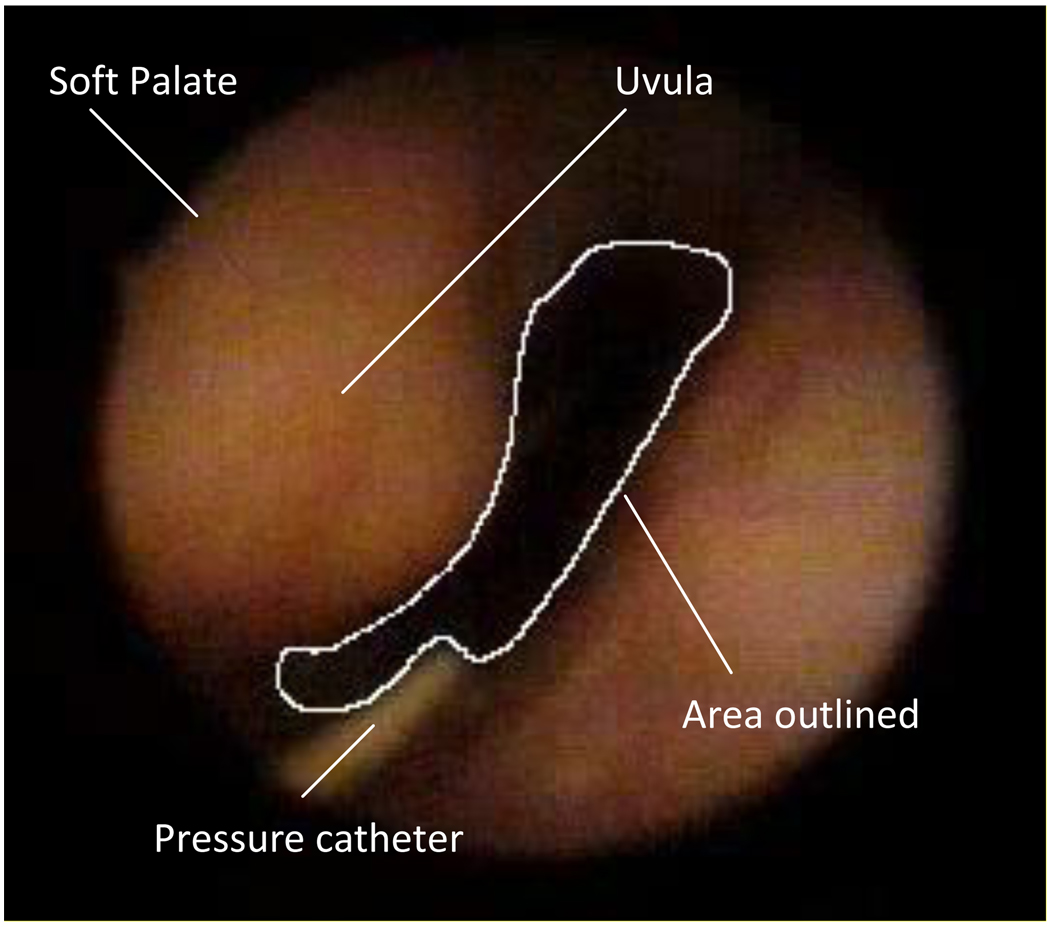
Methods: Eighteen subjects were studied using noninvasive positive pressure ventilation (NPPV) to inhibit ventilatory motor output during stable NREM sleep. Nasopharyngoscopy was used to measure the retro palatal cross-sectional area/pressure relationship (CSA/Pph) in 8 subjects. The effect of NPPV on neck circumference (NC) and end-expiratory lung volumes (EELV) was studied in 10 additional subjects using strain gauge plethysmography and respitrace, respectively.

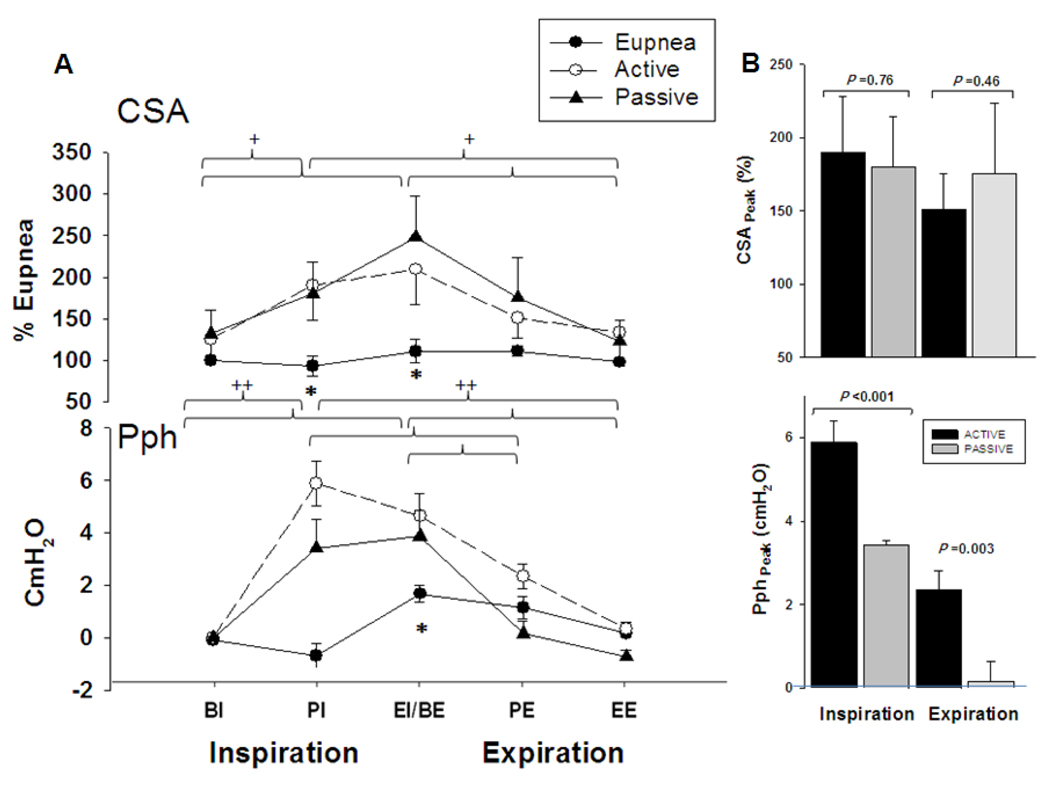
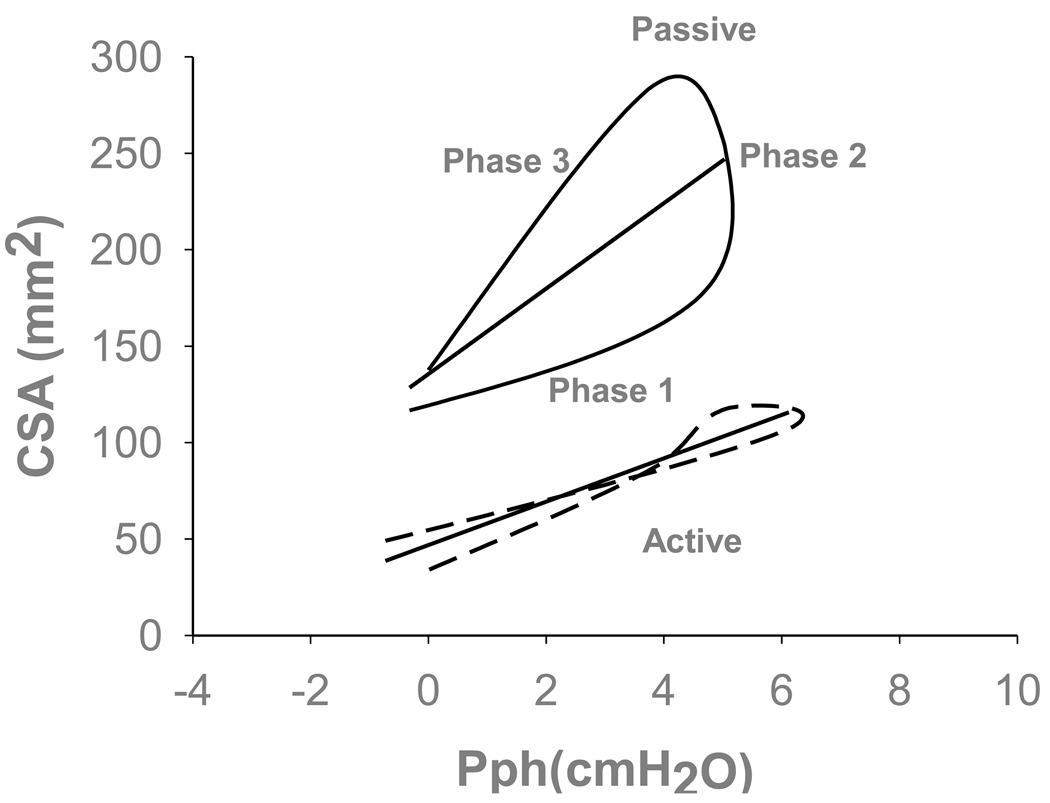
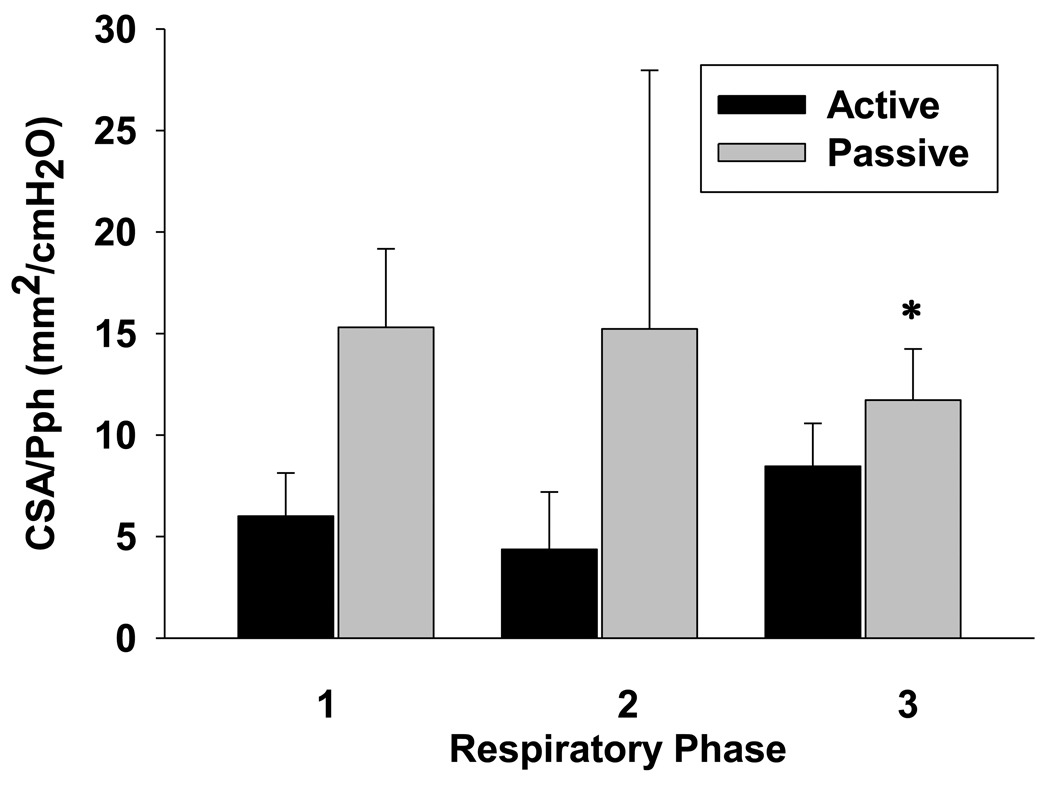
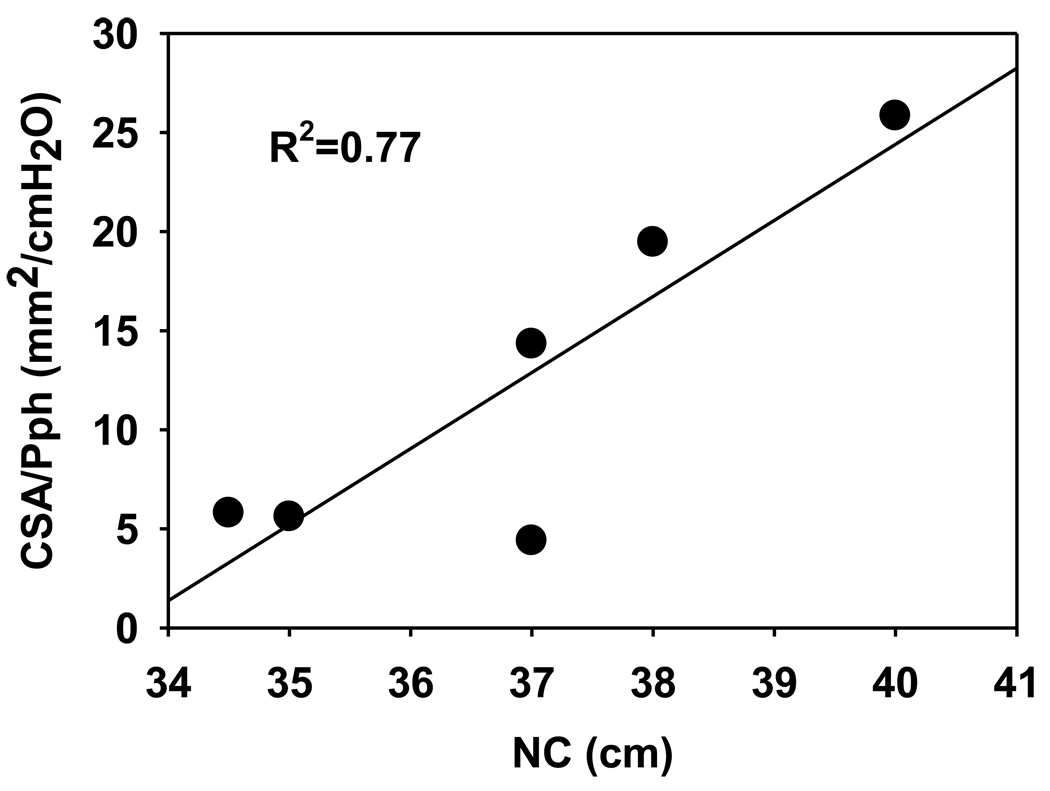
Results: (1) The CSA/Pph was increased during expiration under passive compared to active breathing (11.7 ± 7.1 vs. 8.5 ± 5.6mm(2)/cmH(2)O, respectively; p < 0.05) but not during inspiration. (2) NC correlated with the CSA/Pph during passive expiration (R(2) = 0.77, p < 0.05). (3) NC and EELV did not change between active and passive breaths (p = NS).

Conclusions: (1) Inhibiting the ventilatory motor output increases the pharyngeal compliance. (2) Increased passive expiratory pharyngeal compliance was not associated with changes in NC or EELV.


Figures

Figure 1
Figure 1
Polygraph record of a trial that illustrates breaths during noninvasive positive pressure ventilation (NPPV) followed by central apnea. Ventilatory motor output inhibition was confirmed by the absence of negative pressure deflection on pharyngeal pressure (red arrows) and by the occurrence of central apnea upon termination of NPPV. First three breaths at the beginning of mechanical ventilation (active breaths) were compared to the last three breaths preceding the termination of NPPV (passive breaths). The horizontal dotted line indicates the level of end-tidal CO2 at baseline. Pph, pharyngeal pressure; PETCO2, end-tidal CO2; SaO2, oxygen saturation.
Figure 2
Figure 2
Fiberoptic image of the retro palatal airway with anatomic landmarks identified.
Figure 3
Figure 3
Polygraph record of a trial that illustrates breaths during noninvasive positive pressure ventilation (NPPV) followed by central apnea. End-expiratory lung volume (EELV) and end-expiratory pharyngeal pressure (EEP) were indicated by the dotted lines. RIP: respiratory inductive plethysmograph, Psg: supraglottic pressure, PETCO2, end-tidal CO2, PETCO2, end-tidal O2.
Figure 4
Figure 4
(A) Retro palatal cross-sectional area (CSA) during eupnoea and mechanical ventilation (active and passive, respectively). Note the larger CSA for the mechanical ventilation breaths in comparison to the eupnoea breaths at PI and BE (*p < 0.05 eupnoea vs. active and passive). No difference was found between active vs. passive breaths (p>0.05). There was a statistically significant interaction between phase and type (p <0.001); the effect of different levels of phase depends on what level of type is present. Note that the CSA was similar during eupnoea among the different phases of each respiratory cycle (from BI to EE) but different during mechanical ventilation for active and passive breaths, respectively (+p<0.01). Pharyngeal pressure (Pph) was higher during mechanical ventilation at PI and BE phases in comparison to eupnoea (p<0.05). Pph profile was higher at BE compared to PI during eupnoea (++ p <0.001) and among the different phases of each respiratory cycle of active and passive breaths (++ p<0.001). (B) The top panel illustrates the CSA at peak inspiration and expiration. Note that CSA not change between active and passive breaths (p=NS). Bottom panel illustrates the Pph which were higher during active than passive breathing at peak inspiration and expiration (P<0.05). BI: Beginning inspiration, PI: peak inspiration, EI/BE: end inspiration/beginning expiration PE: peak expiration, EE: end expiration. All presented data are mean ± SE.
Figure 5
Figure 5
Representative example of retro palatal cross sectional area (CSA) and pharyngeal pressure (Pph) relationships for active and passive breaths (dotted and solid lines, respectively). Note that the passive breath displayed hysteresis relative to the triggered active breath on the same positive pressure. The total slope of passive breath is significantly higher than active breath. Partitioned slope of the passive breath is higher during expiration relative to the active breath. Phase 1 (inspiratory) was defined as the slope of the regression line between the beginning of inspiration and peak inspiration. Phase 2 (post-inspiratory) was defined as the slope of the regression line between the peak inspiration and end inspiration. Phase 3 (expiratory) was defined as the slope of CSA vs. Pph between the beginning of expiration and end of expiration. The straight lines represent the total area-pressure relationship for each individual representative breaths defined as the slope of the regression line between the beginning of inspiration and end expiration.
Figure 6
Figure 6
Grouped data for CSA/Pph relationship during active and passive breaths (Phase 1: inspiratory; phase 2: post-inspiratory; and phase 3: expiratory, respectively). Note that the expiratory CSA/Pph relationship for passive (gray bars) was higher than for active breaths (black bars) on the same airway pressure (p<0.05). All presented data are mean ± SE.
Figure 7
Figure 7
Neck circumference (NC) during eupnoea and mechanical ventilation (active and passive, respectively). Note the larger NC for the mechanical ventilation breaths in comparison to the eupnoea breaths (# p < 0.05 eupnoea vs. active). No difference was found between active vs. passive breaths (p>0.05). Supraglottic pressure (Psg) was higher during mechanical ventilation relative to eupnoea at PI, BE, PE phases in comparison to eupnoea (* p<0.05). BI: Beginning inspiration, PI: peak inspiration, EI/BE: end inspiration/beginning expiration PE: peak expiration, EE: end expiration. All presented data are mean ± SE.
Figure 8
Figure 8
Relationship between neck circumference (NC) and expiratory CSA-Pph slopes during passive state.

Similar articles

Cited by

References

    1. Alex CG, Aronson RM, Onal E, et al. Effects of continuous positive airway pressure on upper airway and respiratory muscle activity. J.Appl.Physiol. 1987;62(5):2026–2030. - PubMed
    1. Badr MS, Toiber F, Skatrud JB, et al. Pharyngeal narrowing/occlusion during central sleep apnea. J.Appl.Physiol. 1995;78(5):1806–1815. - PubMed
    1. Badr MS. Effect of ventilatory drive on upper airway patency in humans during NREM sleep. Respir.Physiol. 1996;103(1):1–10. - PubMed
    1. Borowiecki B, Pollak CP, Weitzman ED, et al. Fibro-optic study of pharyngeal airway during sleep in patients with hypersomnia obstructive sleep-apnea syndrome. Laryngoscope. 1978;88(8 Pt 1):1310–1313. - PubMed
    1. Condos R, Norman RG, Krishnasamy I, et al. Flow limitation as a noninvasive assessment of residual upper-airway resistance during continuous positive airway pressure therapy of obstructive sleep apnea. Am.J.Respir.Crit Care Med. 1994;150(2):475–480. - PubMed

Publication types