. 2011 Feb 18;144(4):614-24.
doi: 10.1016/j.cell.2011.01.028.

The coding of temperature in the Drosophila brain

Affiliations

The coding of temperature in the Drosophila brain

Marco Gallio et al. Cell. .

Abstract

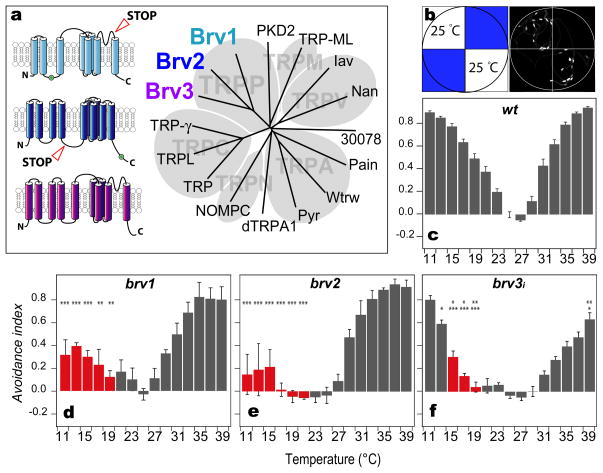
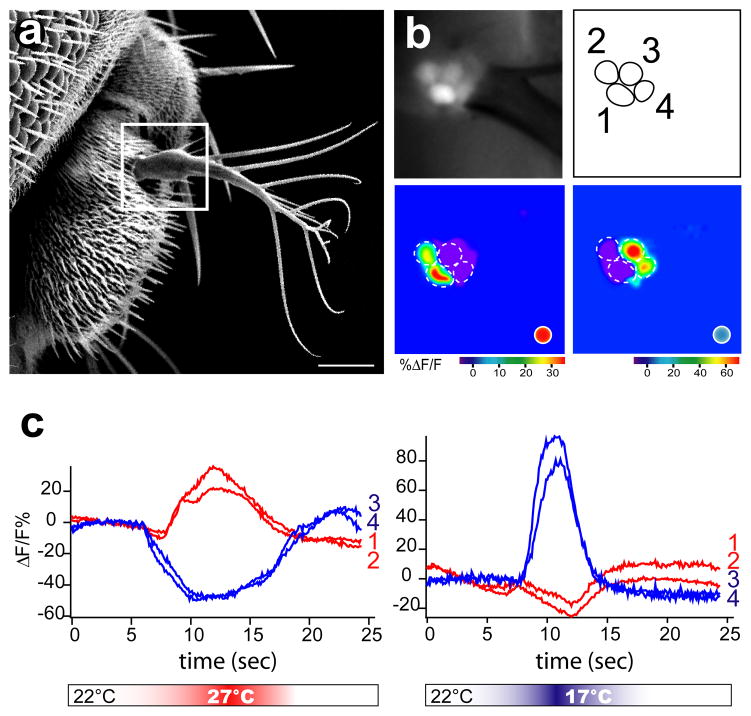
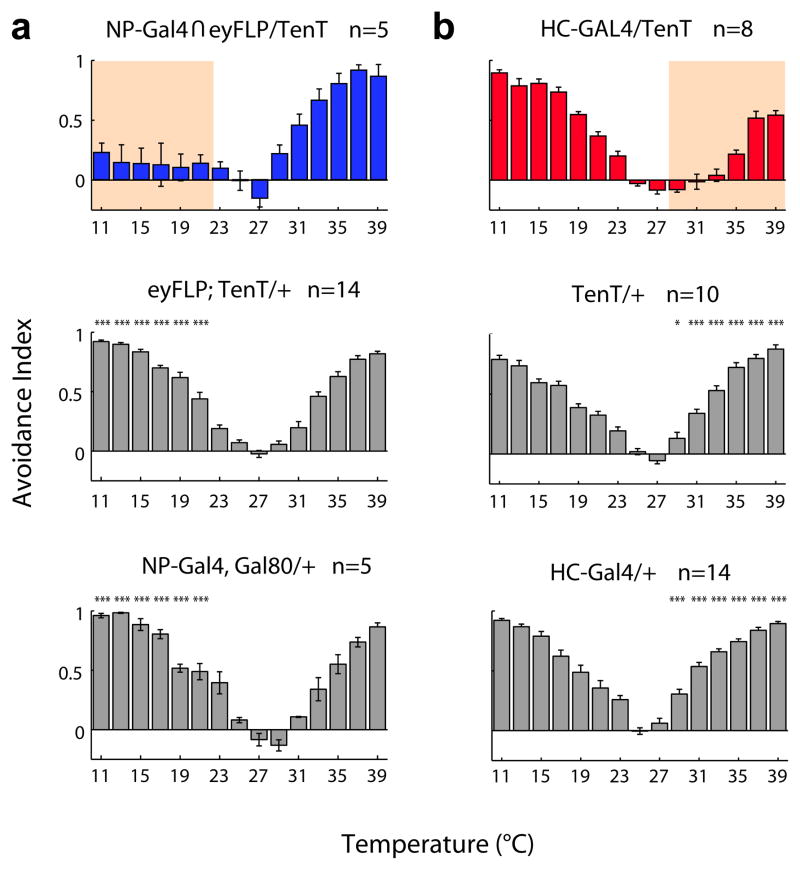
Thermosensation is an indispensable sensory modality. Here, we study temperature coding in Drosophila, and show that temperature is represented by a spatial map of activity in the brain. First, we identify TRP channels that function in the fly antenna to mediate the detection of cold stimuli. Next, we identify the hot-sensing neurons and show that hot and cold antennal receptors project onto distinct, but adjacent glomeruli in the Proximal-Antennal-Protocerebrum (PAP) forming a thermotopic map in the brain. We use two-photon imaging to reveal the functional segregation of hot and cold responses in the PAP, and show that silencing the hot- or cold-sensing neurons produces animals with distinct and discrete deficits in their behavioral responses to thermal stimuli. Together, these results demonstrate that dedicated populations of cells orchestrate behavioral responses to different temperature stimuli, and reveal a labeled-line logic for the coding of temperature information in the brain.


Figures

Figure 1
Figure 1. Temperature preference phenotypes of brivido mutants
(a) Dendogram tree of TRP channels in Drosphila; brivido genes encode 3 members belonging to the TRPP subfamily (Montell et al., 2002). The diagrams to the left illustrate the proposed secondary structure of Brv proteins, and the location of loss-of-function mutations in brv1 and brv2 (STOP). (b,c) Two-choice assay of temperature preference in control flies. (b) Groups of 15 flies are tested in a chamber whose floor is tiled by 4 independently controlled peltier elements. In each trial, a new test temperature (represented in blue) is chosen, and the position of the flies recorded for 180 seconds. Set and reference temperatures are then switched for an additional 3 min trial. (c) Cumulative images of the flies position throughout the trial (illustrated in the right of panel b) are analyzed to compute an avoidance index for each test temperature (grey bars in c, test temperatures varied between 11°C and 39°C, Reference temperature=25°C; n=10, mean±SEM). (d,e,f) Temperature preference phenotypes of (d) brv1L563>STOP , (e) brv2W205>STOP, and (f) scratch-Gal4>brv3(RNAi) flies (n>5, mean±SEM). Red bars denote AI values significantly different from controls in the cold range (p<0.05). In (f), lower asterisks indicate significant difference from scratch-Gal4/+ (Figure S1, panel d) and upper asterisks from +/UAS-brv3RNAi (Figure S1, panel e). In all panels, *** = p<0.001, ** = p<0.01, * = p<0.05, ANOVA. See also Figure S1, panels f-h.
Figure 2
Figure 2. brv1 and -2 function in cold temperature reception in vivo
(a-d) Cold sensing neurons in the Drosophila antenna are revealed by expression of fluorescent reporters under the control of the brv1 enhancer trap NP4486-Gal4. (a) NP4486-Gal4 drives CD8:GFP expression in neurons located in the sacculus region (arrowhead), and in a small number of neurons at the base of the arista (open arrowhead). (b) Camera lucida-style drawing representing the position of the brv1-expressing neurons (the sacculus is represented by a dashed line drawing). (c) High-magnification confocal stack showing ~15–20 brv1-expressing neurons in the sacculus. (d) An NLS:GFP nuclearly localized reporter marks the 3 brv1-expressing cells in the arista (open arrowheads). (e,f) brv1-expressing aristal neurons respond to cooling stimuli. Shown in (e) is a basal fluorescence image, and (f) the maximal response during a stimulus of Δt~5°C (from 22°C to 17°C), the lookup table represents ΔF/F%. (g) Temperature responses are reversible and scale with the magnitude of the stimulus (responses of a single cell are shown as blue traces, ΔF/F%; grey traces denote stimuli in °C; in all panels the scalebar represents 10 μm). (h,i) Loss-of-function mutations in brivido1 and -2 severely affect the responses of the aristal cold-sensing neurons to cooling. Shown are G-CaMP responses from (h) brv1L563>STOP (light blue dots, n=5) and (i) brv2W205>STOP (dark blue dots, n=10) mutant flies compared to control flies (green dots); G-CaMP was expressed under the pan-neural driver elav-Gal4. Each dot represents the response of a single cell to a stimulus; each animal was subjected to a maximum of 5 stimuli of different intensity (see methods, n=5 animals in h and n=10 in i). Note the significant reduction in the responses of mutant animals; we suggest that the small, residual activity seen in each of the mutant s lines is likely the result of overlapping function amongst the different brv genes (see also Figure S2).
Figure 3
Figure 3. Hot and Cold temperature receptors in the Drosophila antenna
(a) Scanning electron micrograph of the Drosophila antenna. The arista (white box) houses 6 neurons, 4 of which are visible on the focal plane shown in b. (b) Basal fluorescence and maximal response images of 4 neurons expressing G-CaMP under the control of elav-Gal4. Functional imaging reveals that these cells respond to either hot (cells 1 and 2) or cold (cells 3 and 4) thermal stimuli (Stimuli are Δt~5°C from 22°C; red dot: hot stimulus; blue dot: cold stimulus). (c) Response profile of the two hot- (cells 1 and 2 in panel b) and the two cold-sensing neurons (cells 3 and 4 in panel b) to a stimulus of Δt~5°C; red traces denote responses of hot cells, and blue traces depict the cold cells. Note that cold sensing neurons display a drop in intracellular calcium in response to hot stimuli, and the hot-sensing neurons display a decrease in intracellular calcium in response to warming (scalebar represents 20 μm, see also Figure S3).
Figure 4
Figure 4. Hot and cold fibers define two distinct glomeruli in the protocerebrum
(a-g) Hot and cold antennal neurons target two distinct, but adjacent glomeruli in the proximal antennal protocerebrum (PAP). (a) Schematic representation of major centers in the fly brain highlighting the position of the PAP (in green). The PAP lies just below the antennal lobe (AL, not shown on the left side of the brain to reveal the PAP); MB, mushroom bodies. SPP: super peduncular protocerebrum. AN: antennal nerve. SOG: sub oesophageal ganglion. (b) PAP projections of antennal cold receptors. NP4486-Gal4 flies carrying ey-FLP (active in the antenna) and a tubulin-FRT>Gal80>FRT transgene, reveal the projections of cold thermoreceptors to the PAP (see text and methods for details). Cold receptor afferents coalesce into a distinct glomerulus at the lateral margin of the PAP (ACT, antennocerebral tract). (c) Hot receptors (labeled by CD8:GFP driven by HC-Gal4) also target the PAP, forming a similar, but non overlapping glomerulus. (d,e) Schematic illustration of the PAP, with superimposed tracings of the projections shown in panels b and c (blue: cold receptors; red: hot receptors). (f, g) Low magnification confocal stacks showing symmetrical innervation of the PAP. Panel (f) shows a brain from a NP4486-Gal4 fly and panel (g) from a HC-Gal4 animal. The strong labeling seen in the antennal nerve (AN) of NP4486-Gal4 flies originates in the NP4486-expressing mechanoreceptors of the 2nd antennal segment; these target the Antennal and Mechanosensory Motor Center (AMMC; data not shown; the scalebar represents 50μm; see also Figure S4).
Figure 5
Figure 5. A map of temperature in the PAP
(a) Cold stimulation elicits robust calcium increases in the cold glomerulus, while (b) hot stimulation results in a specific decrease in Ca2+. Conversely, (c) the hot glomerulus is inhibited by cold stimuli, and (d) activated by hot ones; hot and cold stimuli were Δt~5°C from ~25°C (red spot: hot stimulus; blue spot: cold stimulus; G-CaMP was driven under the control of HC-Gal4 or NP4486-Gal4, respectively). (e) Stimulus-response plot representing the responses of hot (red dots) and cold (blue dots) glomeruli. The responses are proportional to the magnitude of the temperature change, with hot glomeruli increasing G-CaMP fluorescence in response to heating stimuli and decreasing it upon cooling. Vice versa, cold glomeruli are activated by cooling and appear inhibited by heating stimuli (heating or cooling was from 25°C; each dot represents the response of a single glomerulus to a stimulus; each animal expressed G-CaMP under the control of HC-Gal4 or NP4486-Gal4, and was subjected to a maximum of 3 stimuli of different intensity, see methods for details, n=10). (f-m) A similar pattern of activity is recorded in the PAP when G-CaMP is expressed throughout the brain using a pan-neuronal driver (elav-Gal4); two independent experiments in two different animals are shown. Note the segregation in the response to cold (f, i) versus hot (g, l) stimuli (Δt~5°C from 25°C). Panels (h,m) are schematic drawings of the superimposed responses in each animal (see also Figure S5).
Figure 6
Figure 6. Labeled lines for temperature processing
(a, b) The behavioral effects of the inactivation of cold and hot thermoreceptors reveal separate channels for the processing of cold and hot temperatures. (a) Expression of tetanus toxin in antennal cold receptors results in significant loss of aversion for temperatures in the 11-23°C range. In contrast, (b) Inactivation of hot receptors results in the reciprocal phenotype, a selective loss of aversion to temperatures above 29°C. Shown below each experimental genotype are the thermal preference records for the parental control lines (gray bars). Pink shading in (a) and (b) highlights AI values significantly different from both appropriate parental strains (n>5, mean±SEM; *** = p<0.001, ** = p<0.01, * = p<0.05, ANOVA, see methods for details).

Comment in

References

    1. Altner H, Loftus R. Ultrastructure and Function of Insect Thermo- And Hygroreceptors doi:10.1146/annurev.en.30.010185.001421. Annual Review of Entomology. 1985;30:273–295.
    1. Basbaum AI, Bautista DM, Scherrer G, Julius D. Cellular and molecular mechanisms of pain. Cell. 2009;139:267–284. - PMC - PubMed
    1. Bateman A, Birney E, Durbin R, Eddy SR, Howe KL, Sonnhammer EL. The Pfam protein families database. Nucleic Acids Res. 2000;28:263–266. - PMC - PubMed
    1. Bautista DM, Siemens J, Glazer JM, Tsuruda PR, Basbaum AI, Stucky CL, Jordt SE, Julius D. The menthol receptor TRPM8 is the principal detector of environmental cold. Nature. 2007;448:204–208. - PubMed
    1. Benton R, Sachse S, Michnick SW, Vosshall LB. Atypical membrane topology and heteromeric function of Drosophila odorant receptors in vivo. PLoS Biol. 2006;4:e20. - PMC - PubMed

Publication types